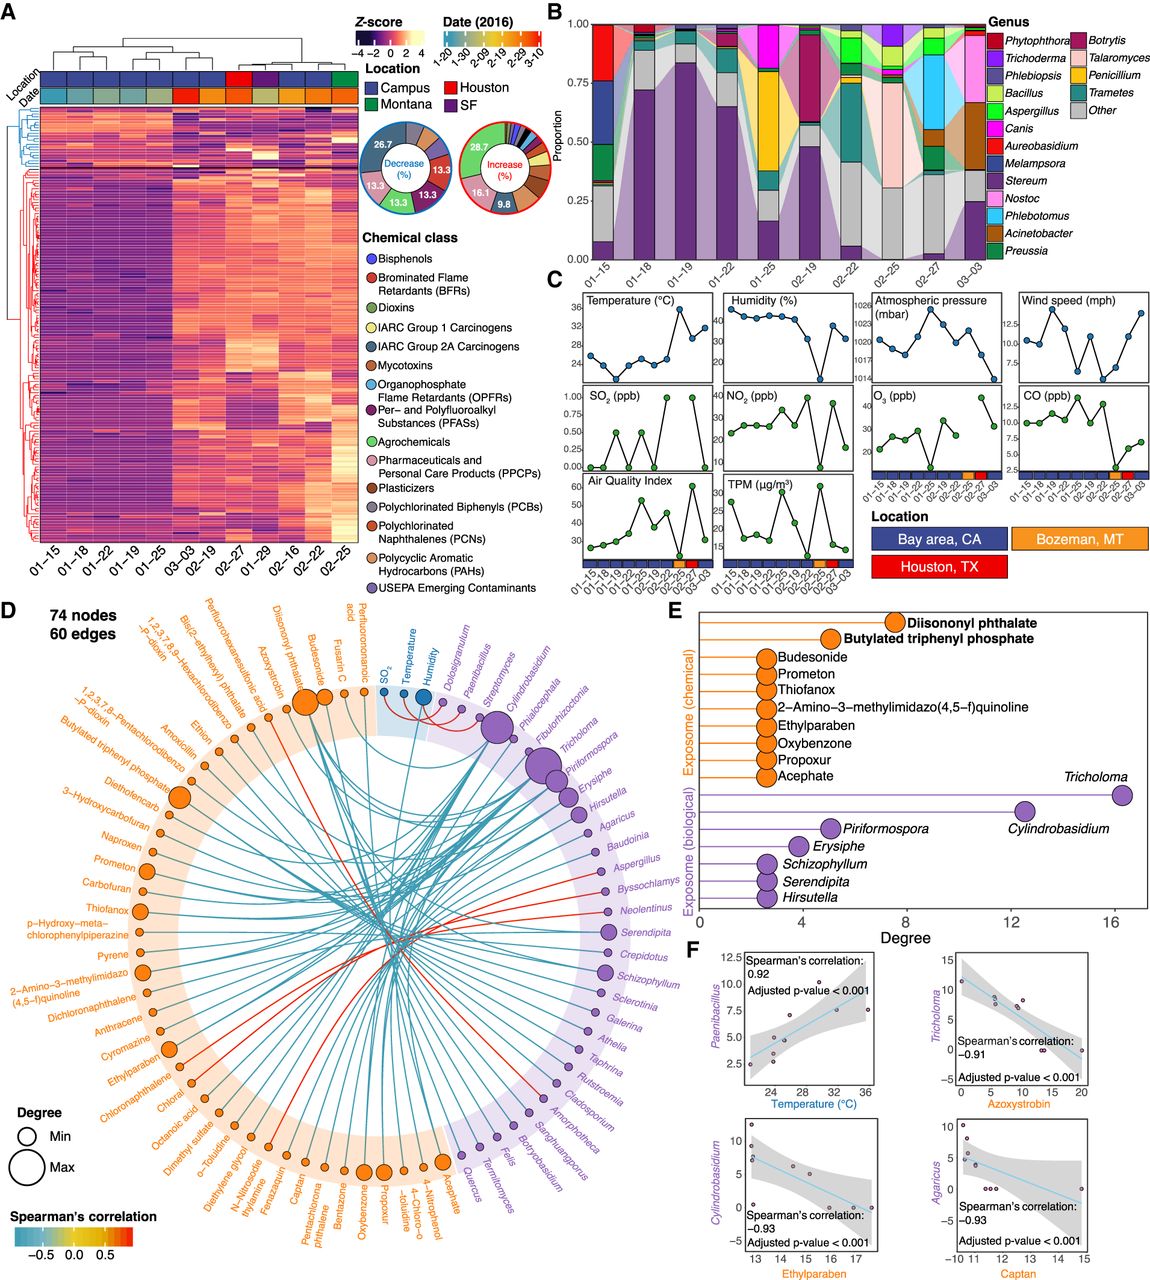
The dynamic and diverse personal exposome cloud. (A) Heat map clustering of the annotated chemical stressors in the exposome ordered by concentrations, with the sector diagrams indicating the increased and decreased chemical groups. The abrupt concentration increase after the January 25 sample indicates the approach can monitor changes of the chemical exposome. (B) Heat map of the top abundant genera annotated in the exposome during each collection period. (C) Environmental factors were collected by either the personal exposometer (temperature, humidity, total particulate matter) or local monitoring stations. (TPM) Total particulate matter. (D) Spearman's correlation analyses within the personal exposome (|r| > 0.9; false-discovery rate [FDR]–adjusted P-value [Q-value] < 0.05). (E) Chemical and biological components that have the most significant correlations with the other substances in the exposome. (F) Representative Spearman's correlation analyses between fungi and temperature/antifungal chemicals.