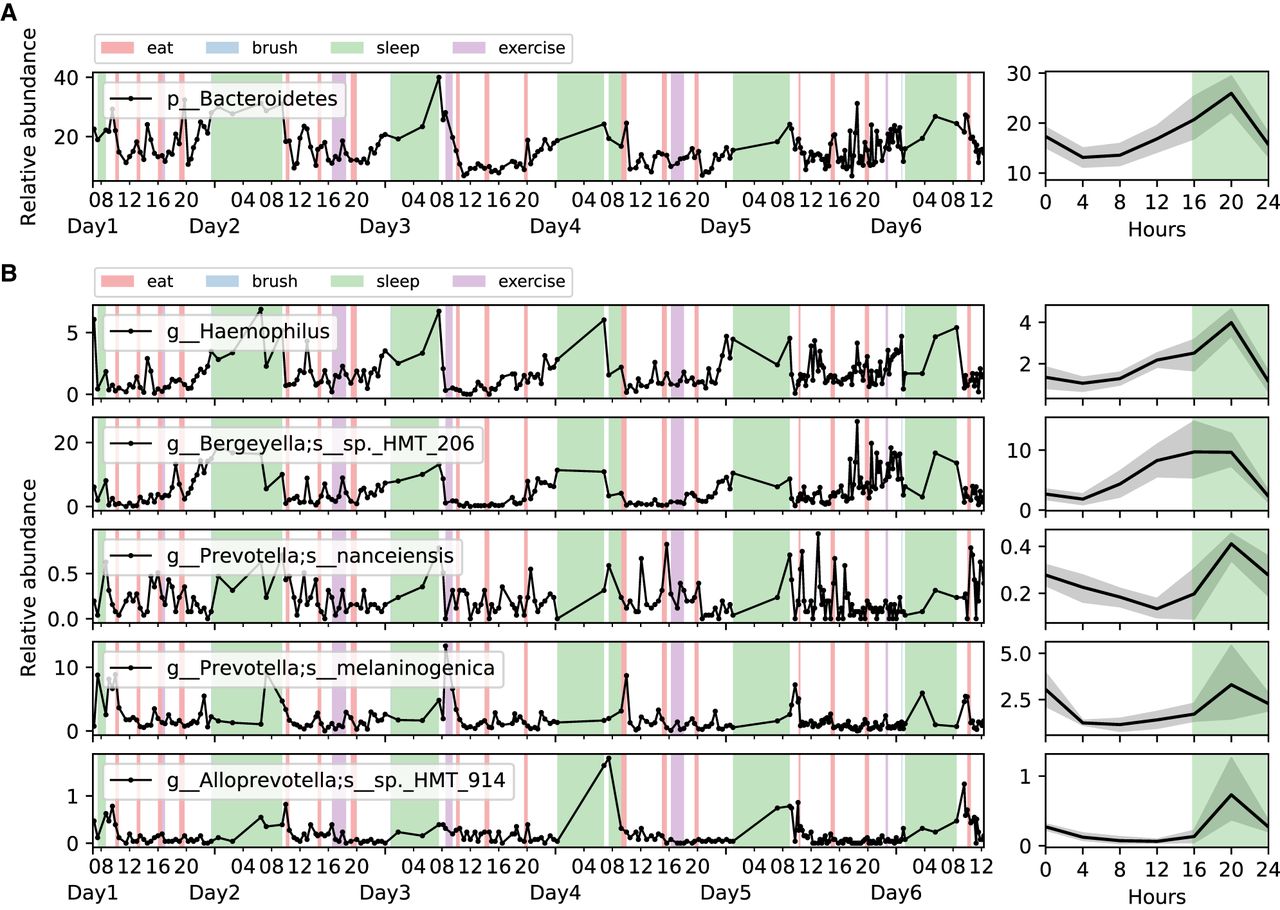
Figure 3.
Diurnal patterns of the salivary microbiome. (A) The phylum that oscillated diurnally in two or more individuals. (B) The ASVs that oscillated diurnally in two or more individuals. (Left) Trace plots. (Right) Abundances of these bacteria averaged over every 24-h window with wake-up time point set as the 0 h for reference. The black line shows the average abundance, with the band depicting the 95% confidence intervals and green shade representing the average sleep window over the experimental period. Microbes of MA are plotted here; the others are in Supplemental Figures S3–S5.