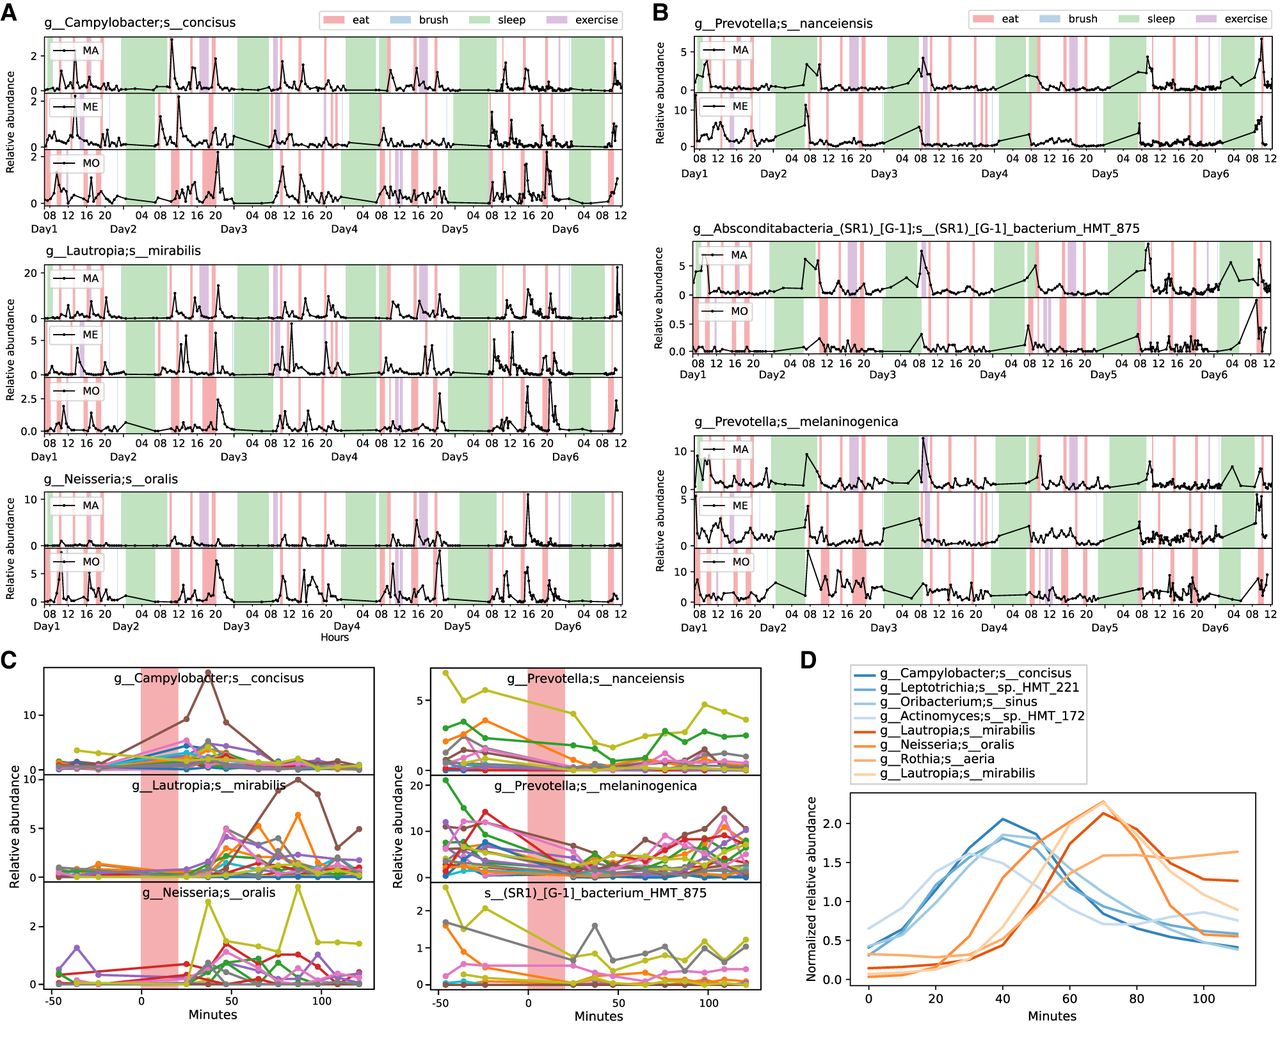
Eating-responsive bacteria. (A) The top three bacteria that increased during eating in the three subjects of MA, ME, and MO. (B) The top three bacteria that decreased during eating. Certain ASVs are missing in some subjects because their prevalences were lower than 10% in those subjects. (C) The bacterial increases can be reproduced in the lunch data set. Lines of distinct colors represent different individuals. (D) Eating-increased bacteria displayed a temporal order after averaging over all the eating time windows, smoothing with moving average, and scaling to the same level. Tongue-specific Campylobacter concisus, Leptotrichia HMT 221, Oribacterium sinus, and Actinomyces HMT 172 increased earlier; teeth-specific Lautropia mirabilis, Neisseria oralis, and Rothia aeria increased later. Blue lines indicate ASVs that were more abundant on tongue dorsum; orange lines indicate ASVs that were more abundant on dental plaque.