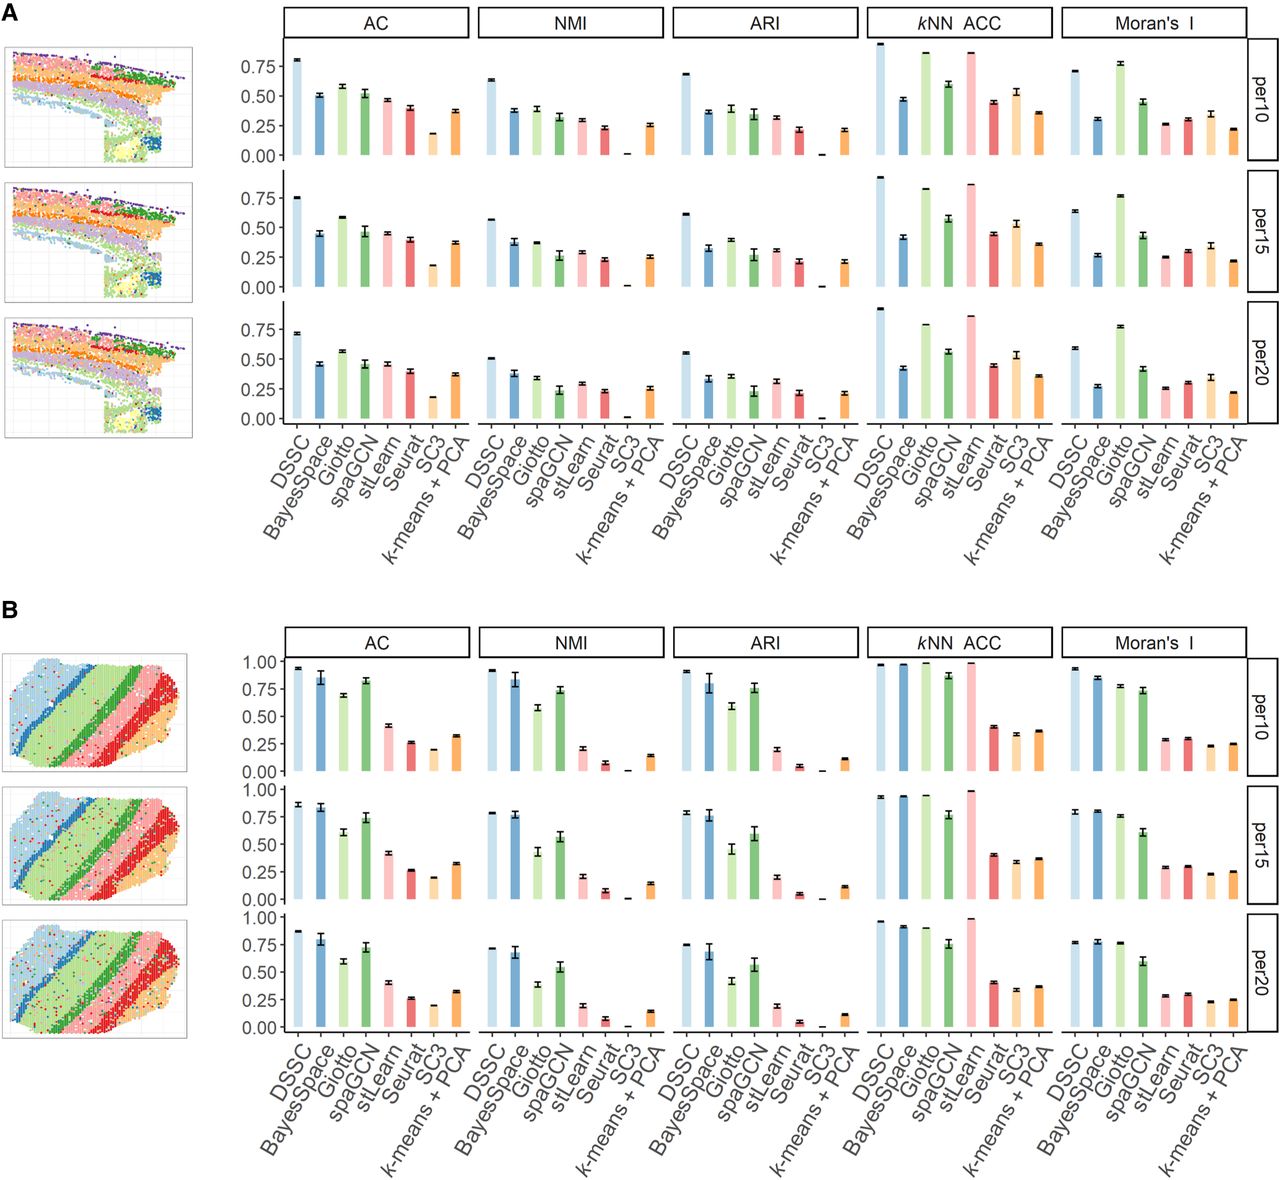
Figure 2.
Simulation results from the spatial organization 1 (A; from osmFISH data) and 2 (B; from spatialLIBD sample 151507). True labels with 10%, 15%, and 20% perturbed coordinates are shown on the physical spaces (left). The corresponding clustering results are shown in the bar plots (right).