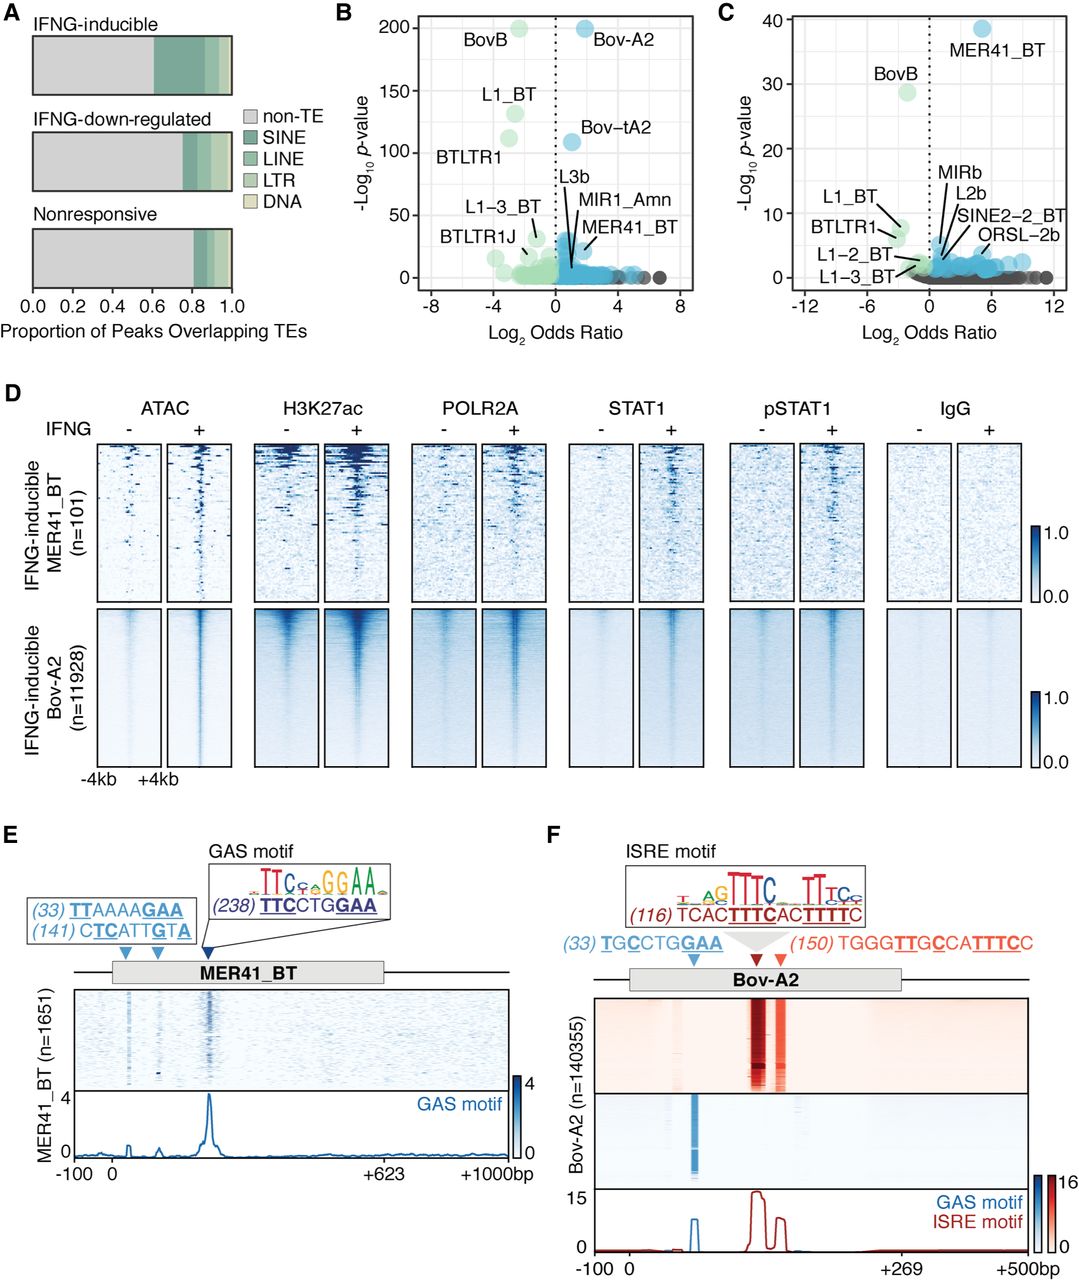
Contribution of ruminant-specific TEs to the IFNG-inducible regulatory landscape. (A) Proportion of IFNG-inducible (n = 4198), IFNG-down-regulated (n = 1548), and nonresponsive H3K27ac peaks (n = 3494) where the internal ATAC-seq summit overlaps a TE. (B) Volcano plot visualizing family-level TE enrichment for IFNG-inducible H3K27ac. TE families with a Fisher's two-tailed P-value < 0.05 were defined as enriched (blue) or depleted (green) based on the reported odds ratio. Nonsignificant families are shown in gray. (C) Family-level TE enrichment for IFNG-inducible STAT1 peaks, as in B. (D) Heat maps showing normalized MDBK ATAC-seq and CUT&RUN signal over IFNG-inducible MER41_BT (n = 101) and Bov-A2 (n = 11928) elements sorted by descending mean CPM-normalized signal. (E) Schematic of IFNG-associated motifs within the MER41_BT consensus and extant sequences (n = 1651) filtered for those that are at least 50% of full length relative to the consensus and sorted by descending CPM-mean normalized signal. Bottom metaprofile represents average signal across all elements. (F) Schematic of motifs as in E but across 140355 Bov-A2 elements, filtered for those within 5% of full length relative to the consensus. Heat map intensity corresponds to motif matches based on the log likelihood ratio. Partial matches are shown in light blue or light red, and the numbers in parentheses represent the position of each predicted motif in the consensus sequence.