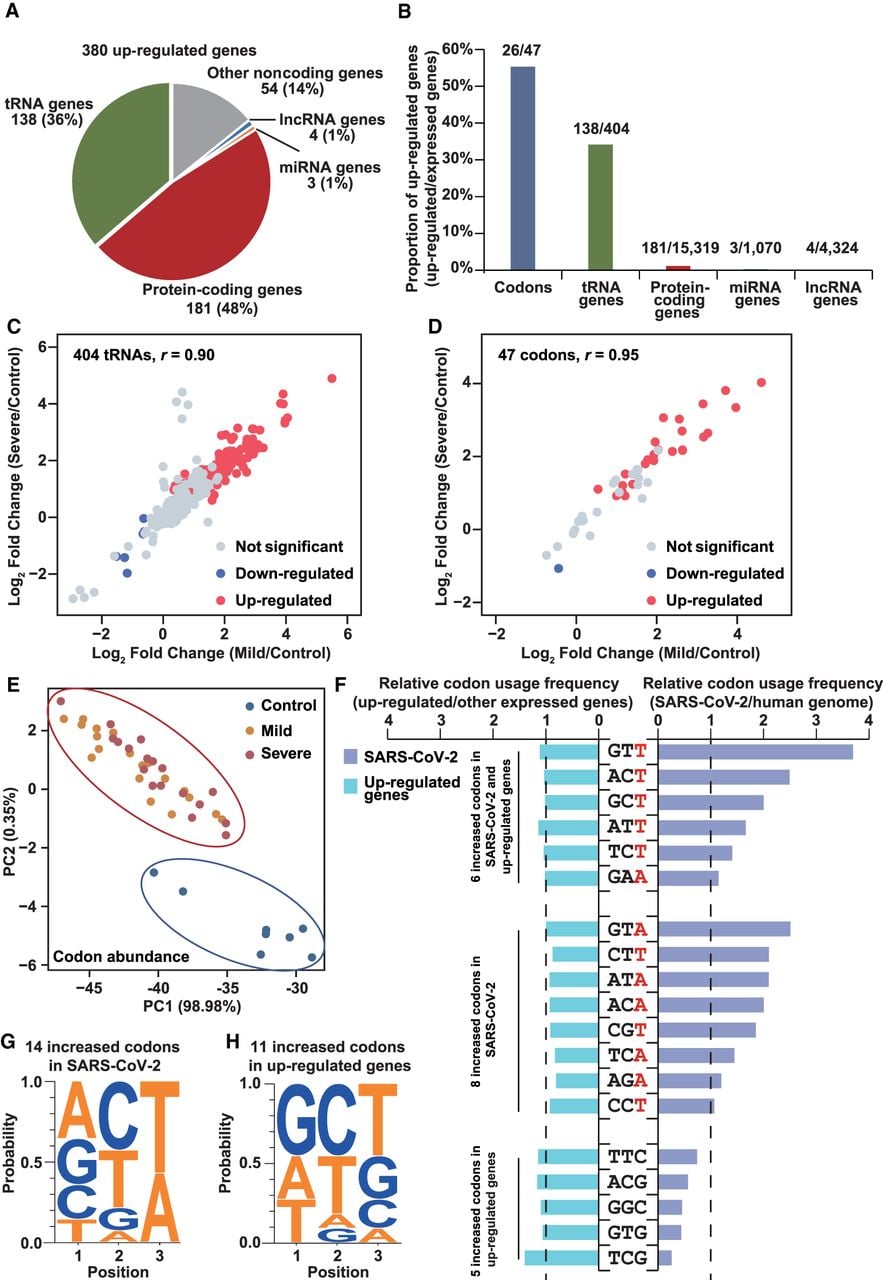
Aberrant tRNA pools and codon abundance in COVID-19 patients. (A) Pie plot showing the composition of the 380 up-regulated genes in COVID-19 patients compared with healthy donors. (B) Bar plot showing the proportion of up-regulated genes and codons in COVID-19 patients compared with healthy donors. (C) Scatterplot showing up-regulated (red) and down-regulated (blue) tRNA genes of COVID-19 patients relative to healthy donors. (D) Scatterplot showing up-regulated and down-regulated codons of COVID-19 patients relative to healthy donors. (E) PCA plot of codon abundance in all samples. The abundance of 47 detected codons shown in D was used to draw this plot. (F) Relative codon usage frequency of 19 up-regulated codons in up-regulated genes (left) and the SARS-CoV-2 genome (right). The codon usage frequency of the 19 up-regulated codons in other expressed genes (left) and human genome (right) was set to 1. (G) Nucleotide composition of 14 up-regulated codons which were more frequently used in the SARS-CoV-2 genome compared to the human genome. (H) Nucleotide composition of 11 up-regulated codons which were more frequently used in the up-regulated genes compared to the other expressed genes.