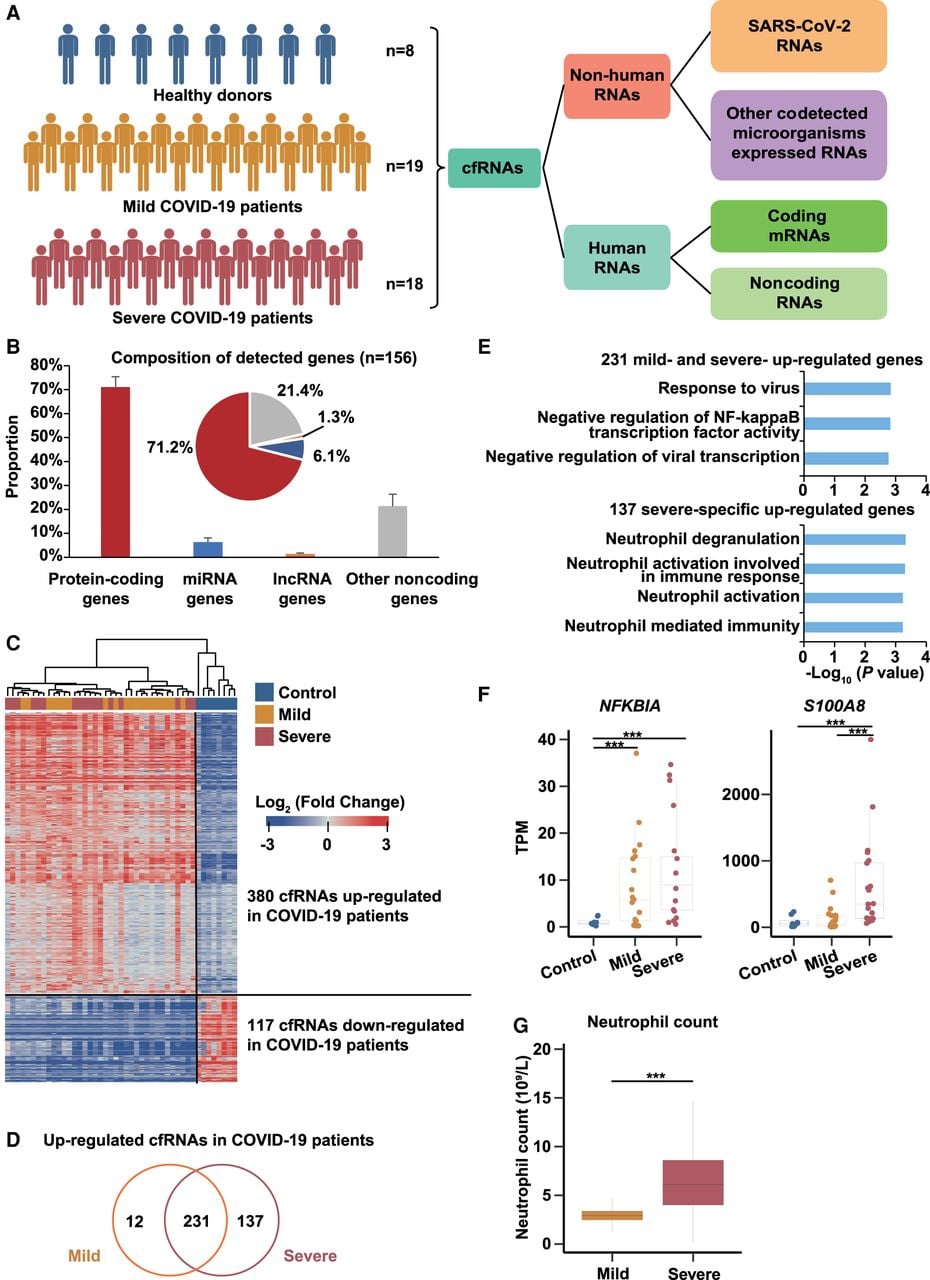
The plasma cfRNA landscape reveals pathogenesis of COVID-19 patients. (A) Schematic diagram showing samples and analysis procedure of this study. The cfRNAs were collected from eight healthy donors, 19 mild COVID-19 patients, and 18 severe COVID-19 patients. (B) Bar plot and pie plot showing the composition of detected genes in all samples. Data are shown as mean + SD (n = 156). (C) Heat map showing fold changes of 380 up-regulated cfRNA genes and 117 down-regulated cfRNA genes in COVID-19 patients. Fold changes of the 380 up-regulated genes were relative to healthy donors, and those of the 117 down-regulated genes were relative to COVID-19 patients. Blue and red represent log2-transformed fold changes < 0 and > 0, respectively. (D) Overlapping of up-regulated genes in mild and severe COVID-19 patients. (E) GO enrichment analyses of 231 up-regulated cfRNA genes in COVID-19 patients and 137 cfRNA genes specific up-regulated in severe COVID-19 patients. (F) Box plot showing expression levels (TPMs) of NFKBIA and S100A8 in healthy donors, mild, and severe COVID-19 patients. (G) Box plot showing the neutrophil count in mild and severe COVID-19 patients. Asterisks indicate statistically significant differences; (***) P < 0.001.