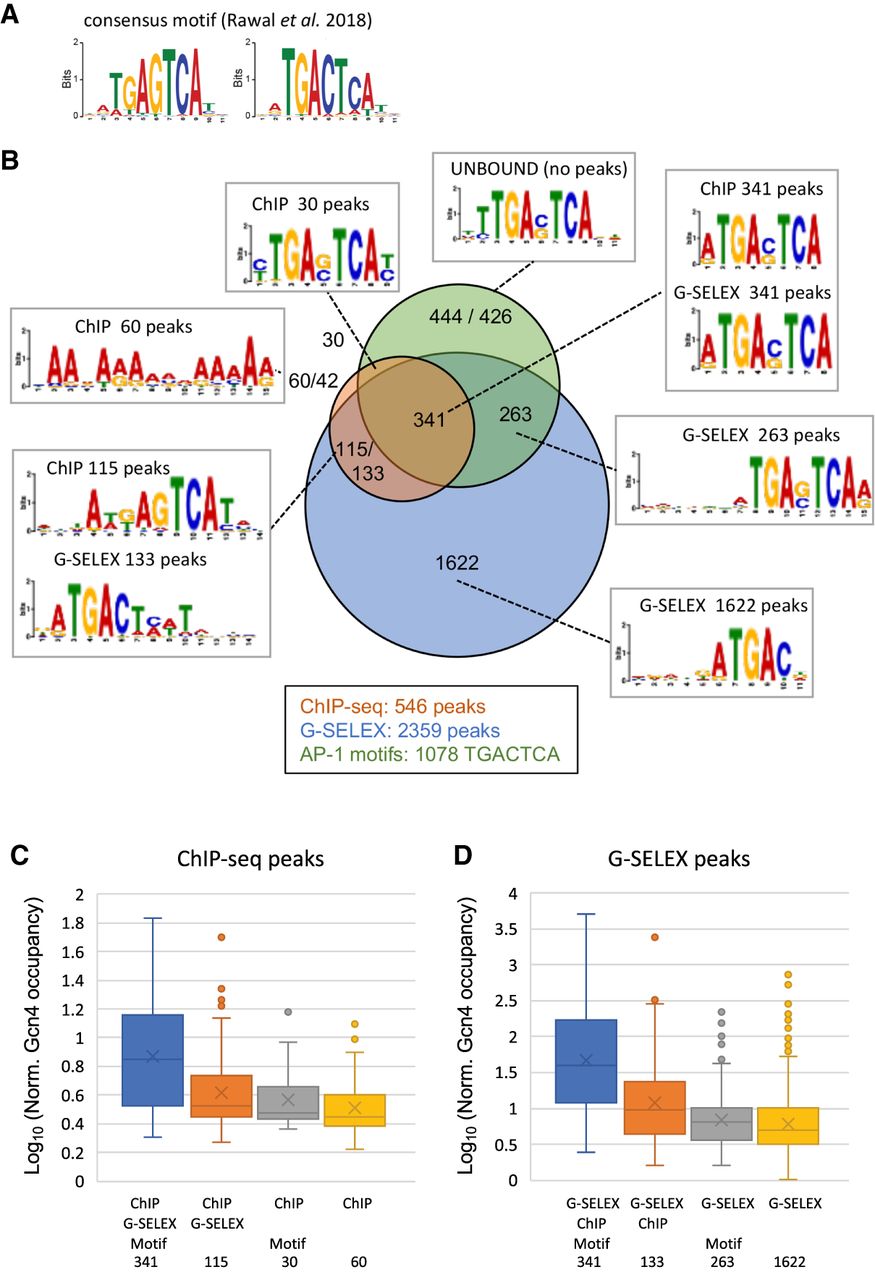
Qualitative and quantitative comparison of Gcn4 binding in vivo (ChIP-seq data) and in vitro (G-SELEX data). ChIP-seq data for Gcn4 are from Rawal et al. (2018). (A) Consensus motif (both strands) for Gcn4 binding from Rawal et al. (2018). (B) Qualitative comparison of ChIP-seq and G-SELEX peak overlaps and with the genomic locations of AP-1 motifs (TGACTCA). Venn diagram: ChIP-seq (orange), G-SELEX (blue), and AP-1 motifs (green). Some ChIP peaks overlap with two G-SELEX peaks and/or two AP-1 motifs, as indicated by two numbers. Motifs were derived using MEME. Quantitative comparison of different classes of (C) ChIP-seq and (D) G-SELEX peaks defined by the Venn diagram are listed below each plot. Gcn4 occupancy data were normalized to the genomic average (set at 1).