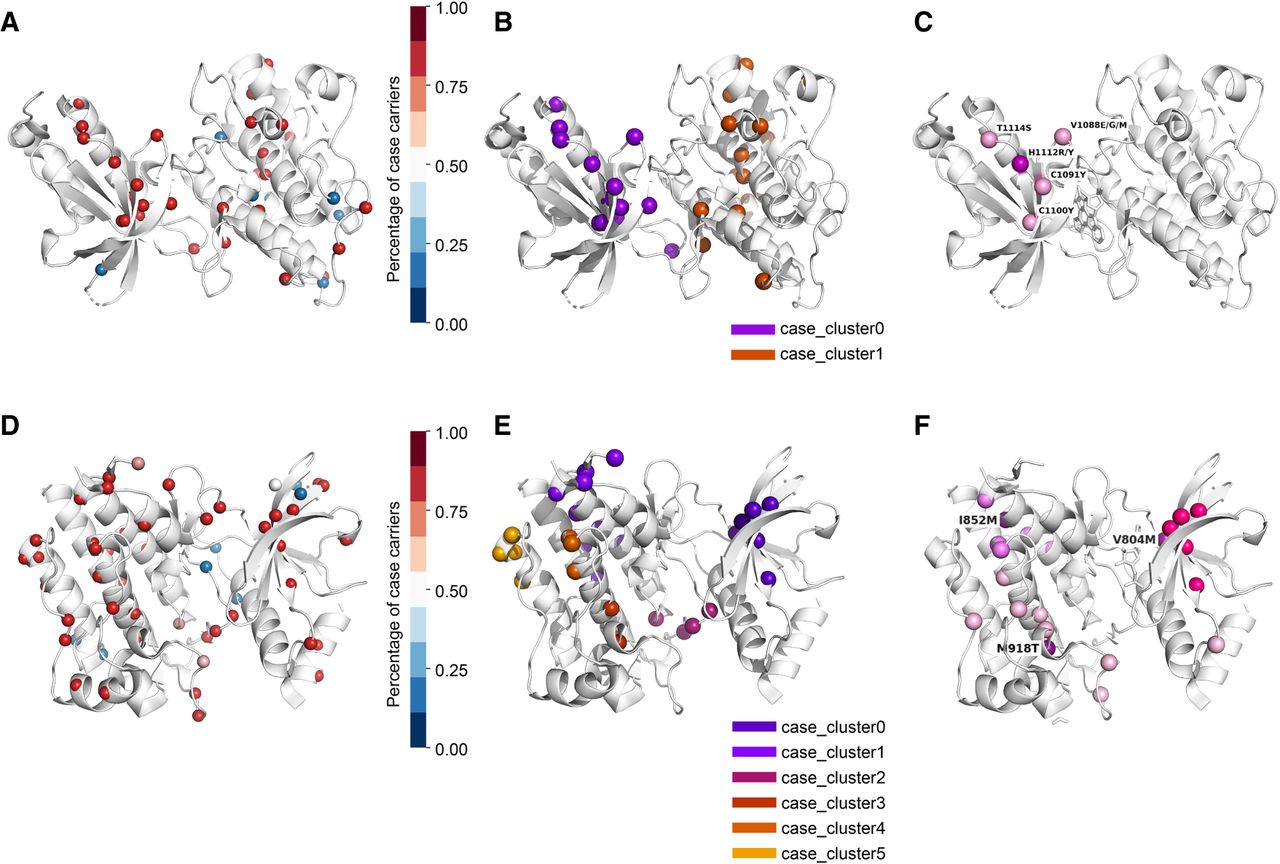
Spatial distribution of variants from TCGA data set within MET (PDB:1R0P) and RET (PDB:2IVT). (A) Rare missense variants mapped to the MET. The color scale indicates the percentage of case subjects that carry the variant of all subjects that have this variant. (B) Signal regions identified by POKEMON in MET. (C) A hotspot formed by germline and somatic variants is identified in Huang et al. (2018). Pathological variant H1112R/Y within the hotspot is highlighted with purple sphere models. (D) Rare missense variants mapped to the RET. (E) RET has signal regions identified by POKEMON. (F) Three hotspots formed by germline and somatic variants are identified in Huang et al. (2018). Three hotspots surrounding M918T, I852M, and V804M are colored pink, violet, and hot pink, respectively. M918T, I852M, and V804M are highlighted with purple sphere models.