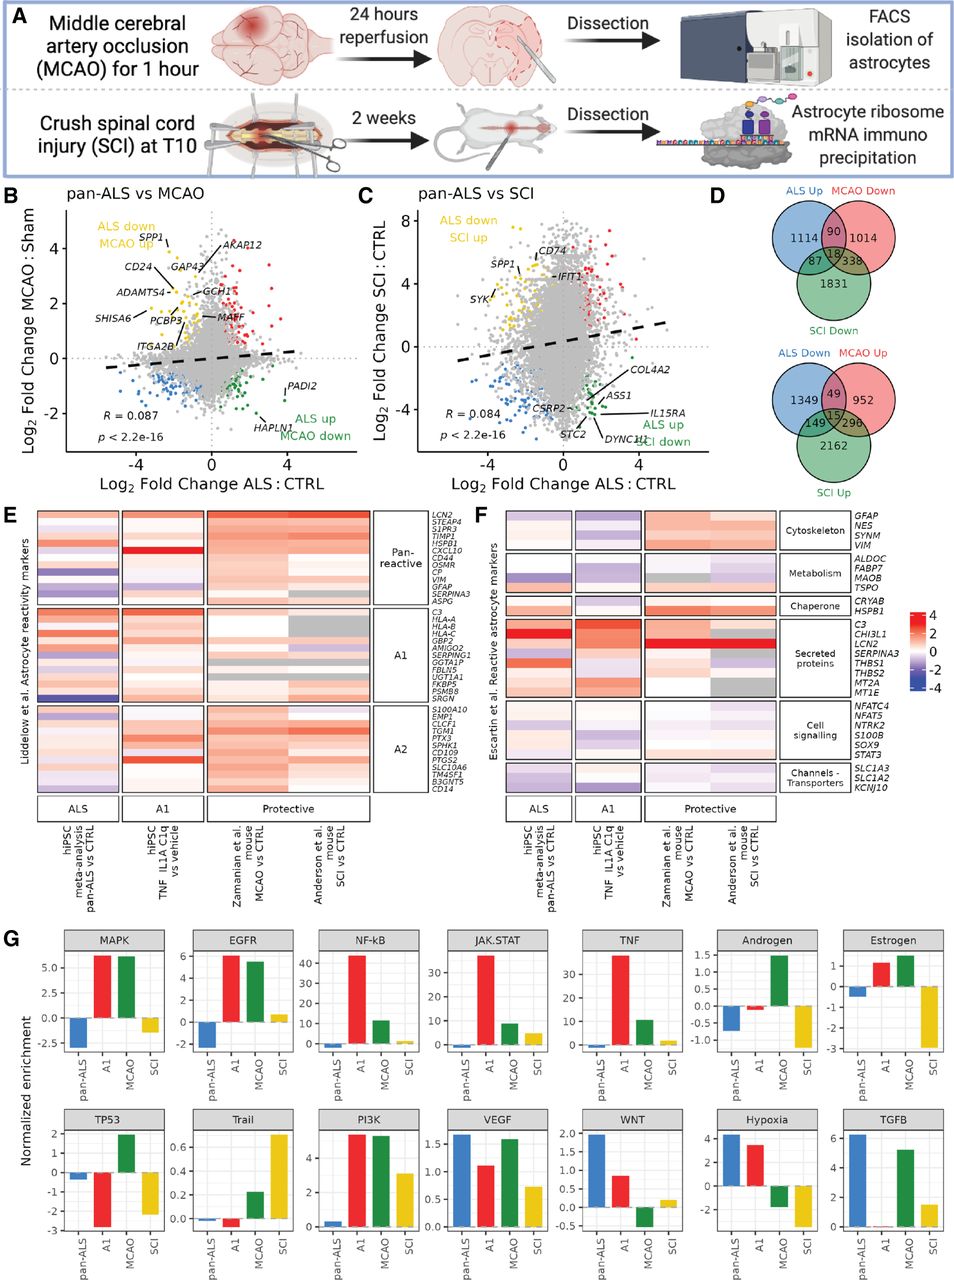
hiPSC ALS astrocytes show convergent and divergent changes compared to protective astrocytes. (A) Schematic showing mouse models of protective astrocytes. Top row represents a middle cerebral artery occlusion (MCAO) model followed by dissection and astrocyte FACS isolation before RNA sequencing. Bottom row shows spinal cord injury (SCI) followed by scar dissection and astrocyte ribosome–associated RNA hemagglutinin immunoprecipitation. (B,C) Scatterplots of log2 fold changes in gene expression in pan-ALS versus control astrocytes (x-axis) against MCAO versus sham astrocytes (B; y-axis) and SCI versus control astrocytes (C). Black dashed line indicates linear regression correlation (Pearson's correlation, both R = + 0.09). Overlapping differentially expressed genes are colored red (up-regulated) and blue (down-regulated). Genes increased in ALS but decreased in the protective astrocytes are shown in green, whereas genes decreased in ALS and increased in protective astrocytes are yellow. (D) Venn diagram depicting the number of differentially expressed genes (FDR < 0.05) increased in ALS but decreased in the protective astrocytes (top) and genes decreased in ALS but increased in protective astrocytes (bottom). (E,F) Heatmaps of Liddelow et al. (2017) pan-reactive, A1- and A2-specific astrocyte reactivity markers (E) and (Escartin et al. 2021) markers of reactive astrocytes (F; rows) in the hiPSC ALS astrocyte meta-analysis, A1 (TNF, IL1A, C1q) protocols and protective (MCAO and SCI) data sets (columns). Color intensity represents the scaled differential gene expression log2 fold changes in pan-ALS versus control; A1 versus A0, MCAO versus sham, and SCI versus control astrocytes. For ALS individual data sets, see Supplemental Figure S3. (G) PROGENy signaling pathway activity normalized enrichment scores (y-axis) in pan-ALS (blue), hiPSC A1 (red), MCAO (green), and SCI (yellow) astrocytes.