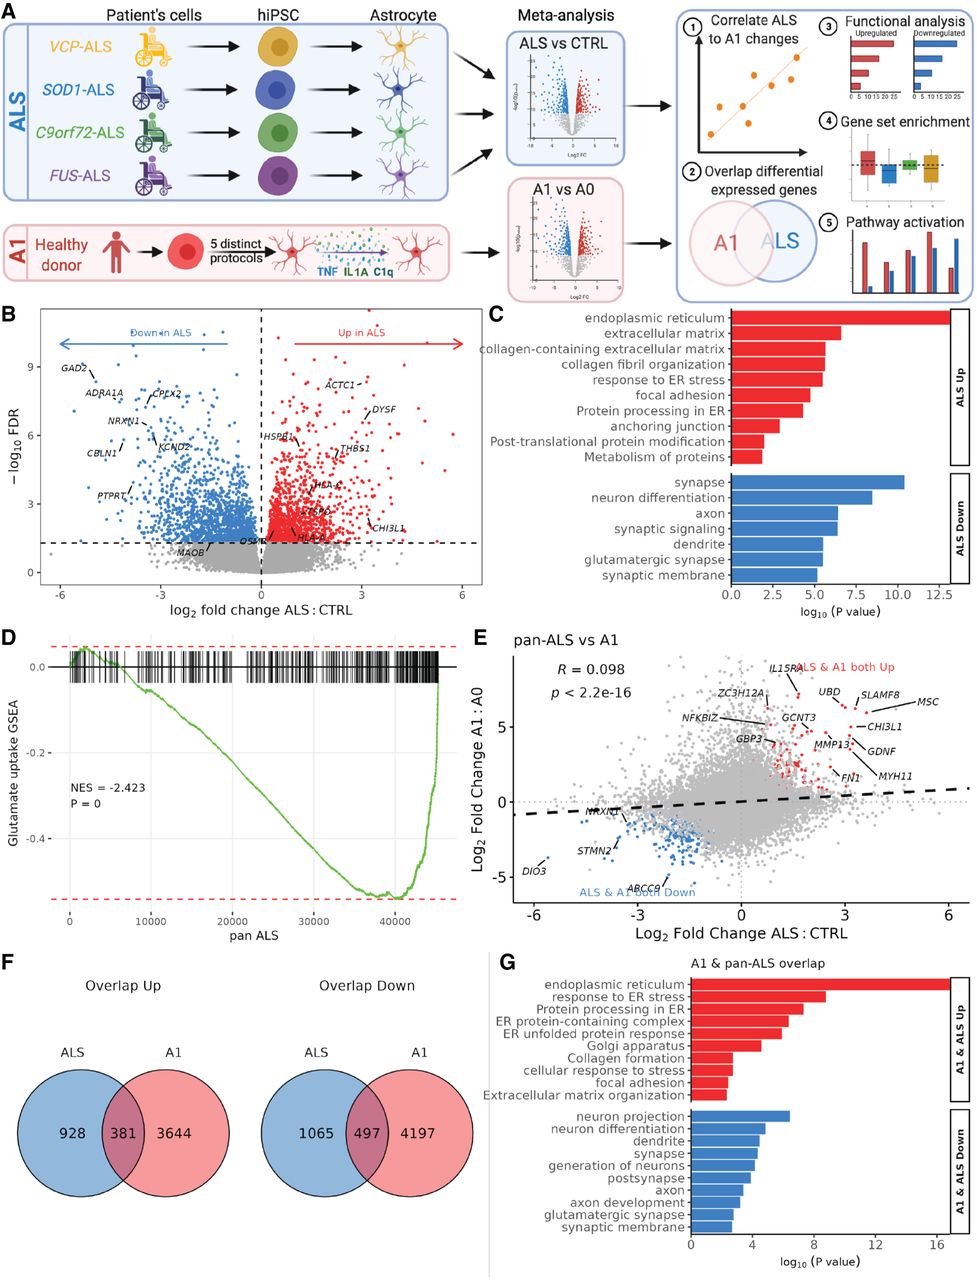
Meta-analysis of ALS hiPSC-astrocytes and correlation with A1 astrocytes. (A) Schematic depicting hiPSC-astrocyte differentiation in ALS mutant astrocytes (VCP, yellow; SOD1, blue; C9orf72, green; FUS, purple) and A1 hiPSC-astrocytes from five distinct differentiation protocols (red). Astrocytes underwent RNA sequencing and were analyzed for differential expression, with meta-analyses of ALS mutants (blue, top) and A1 astrocytes (red, bottom). We then ran a downstream bioinformatic analysis by mapping each gene's expression change in ALS versus control with that of A1 versus A0. (B) Volcano plot showing log2 fold change in differential gene expression from the ALS meta-analysis for pan-ALS versus control astrocytes. Genes with significantly (FDR < 0.05) increased expression are shown in red, and those decreased in expression are shown in blue. (C) GO terms enriched in up-regulated (red) and down-regulated (blue) differentially expressed genes in pan-ALS versus control astrocytes. (D) Gene set enrichment analyses (GSEA) plot for glutamate uptake in pan-ALS astrocytes. (NES) Normalized enrichment score. Enrichment P-value < 1 × 10¹⁰. (E) Scatterplot of log2 fold changes in gene expression in pan-ALS versus control astrocytes (x-axis) against A1 versus A0 astrocytes (y-axis). Black dashed line indicates linear regression correlation (Pearson's correlation R = + 0.1). Overlapping differentially expressed genes are colored red (up-regulated) and blue (down-regulated). (F) Venn diagram depicting the overlap of up-regulated (left) or down-regulated (right) genes (FDR < 0.05) in ALS versus control (blue) and A1 versus A0 (red). (G) Bar graph showing curated overrepresented functional categories (FDR < 0.05) by GO analysis of the genes commonly up-regulated (red) and co-down-regulated (blue) between A1 and ALS astrocytes.