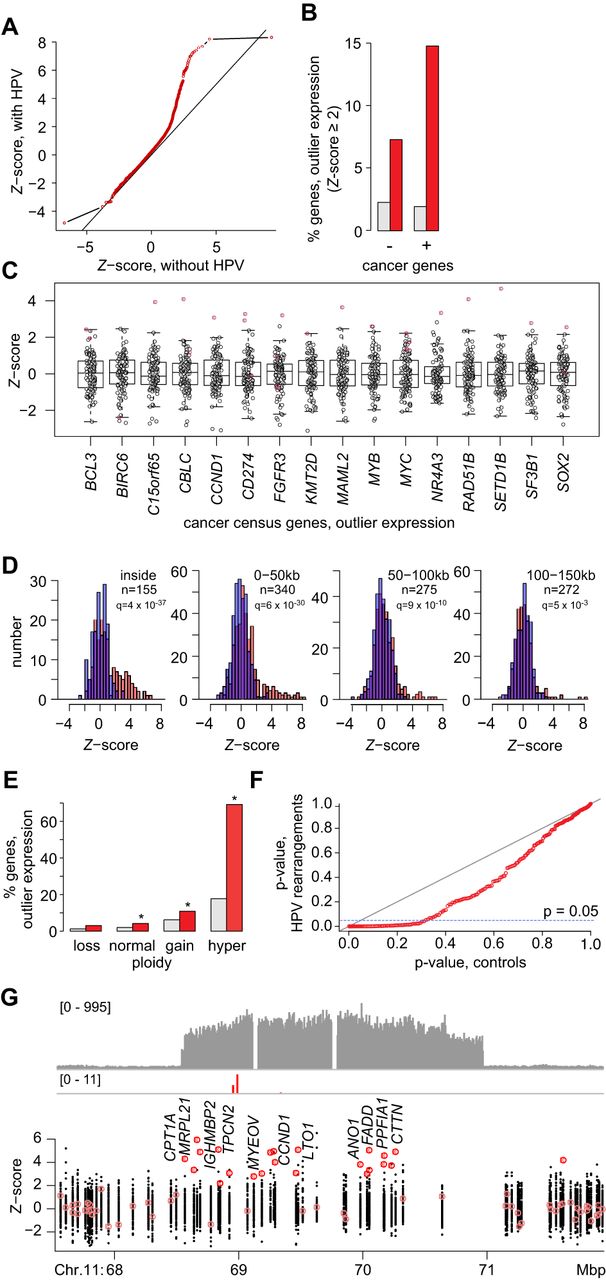
HPV integrants are associated with outlier expression of neighboring host genes. (A) Q-Q plot compares Z-score distributions of expression levels for genes near (±500 kb) virus–host breakpoints (y-axis) versus expression of the same genes without nearby breakpoints in all other tumors (x-axis; Kolmogorov–Smirnov test, P < 2.2 × 10⁻¹⁶). Line of identity (dark gray). (B) Percent of genes with outlier expression that are not cancer genes (–, left) or are cancer genes (+, right) as per Cancer Gene Census Database, and are not (gray) or are (red) within ±150 kb of an HPV integrant (Fisher's exact test, FDR correction, P = 2.2 × 10⁻¹¹ [left] and P = 7.2 × 10−55 [right], respectively). (C) Of 220 genes expressed at outlier levels (Z-score ≥ 2 or ≤−2) in ≥1 tumor and within ±500 kb of a breakpoint, 16 are cancer genes as shown. Box and whiskers plot, Z-scores (y-axis) for cancer genes (x-axis) in samples harboring nearby breakpoints (red) versus lacking them (no fill). (D) Comparison of gene counts (y-axis) expressed at various levels (Z-scores, x-axis), grouped in 50-kb genomic distances from the nearest breakpoint, in tumors with (red) and without (blue) breakpoints in those segments. Of 194 genes harboring breakpoints, 155 are expressed as per available RNA-seq data. Left to right, breakpoints across the tumors inside or outside genes as indicated; n, counts; q = adj. P-values, binomial test. (E) Percentages of genes expressed at outlier levels (Z ≥ 2) at indicated copy numbers (x-axis) in absence (gray) or presence (red) of breakpoints within ±500 kb. Copy number loss, n < 1.5; normal, 1.5 ≤ n ≤ 2.5; gain 2.5 ≤ n ≤ 5; hyper-gain n > 5. Asterisks, adj. P < 1 × 10⁻⁴, binomial test, one-tailed, adjusted by FDR. (F) Q-Q plot of χ2adjusted P-values calculated from comparison of gene expression Z-score distributions (i.e., sum of the square of Z-scores) at chromosomal loci with HPV-mediated rearrangements (y-axis) versus matched loci without rearrangements (x-axis). (G, top) Depth of sequencing coverage (y-axis); (bottom) Z-scores of log2 TPM (y-axis) for genes in a tumor with an HPV-linked rearrangement on Chr 11q13.3 (x-axis); genes with outlier expression (red fill). Breakpoints (red vertical lines) mapping within a 2.4-Mbp region with eightfold amplification result in outlier expression (Z-score ≥ 2) for 22 (67%) of 33 genes including cyclin D1 (CCND1). Tumor with HPV-linked rearrangement: Z-score < 2 (pink), outlier Z-score ≥ 2 (red); all other tumors without detectable local HPV insertions (black). See also Supplemental Figures S4.1, S4.2 and Supplemental Tables S5.1–S5.3.