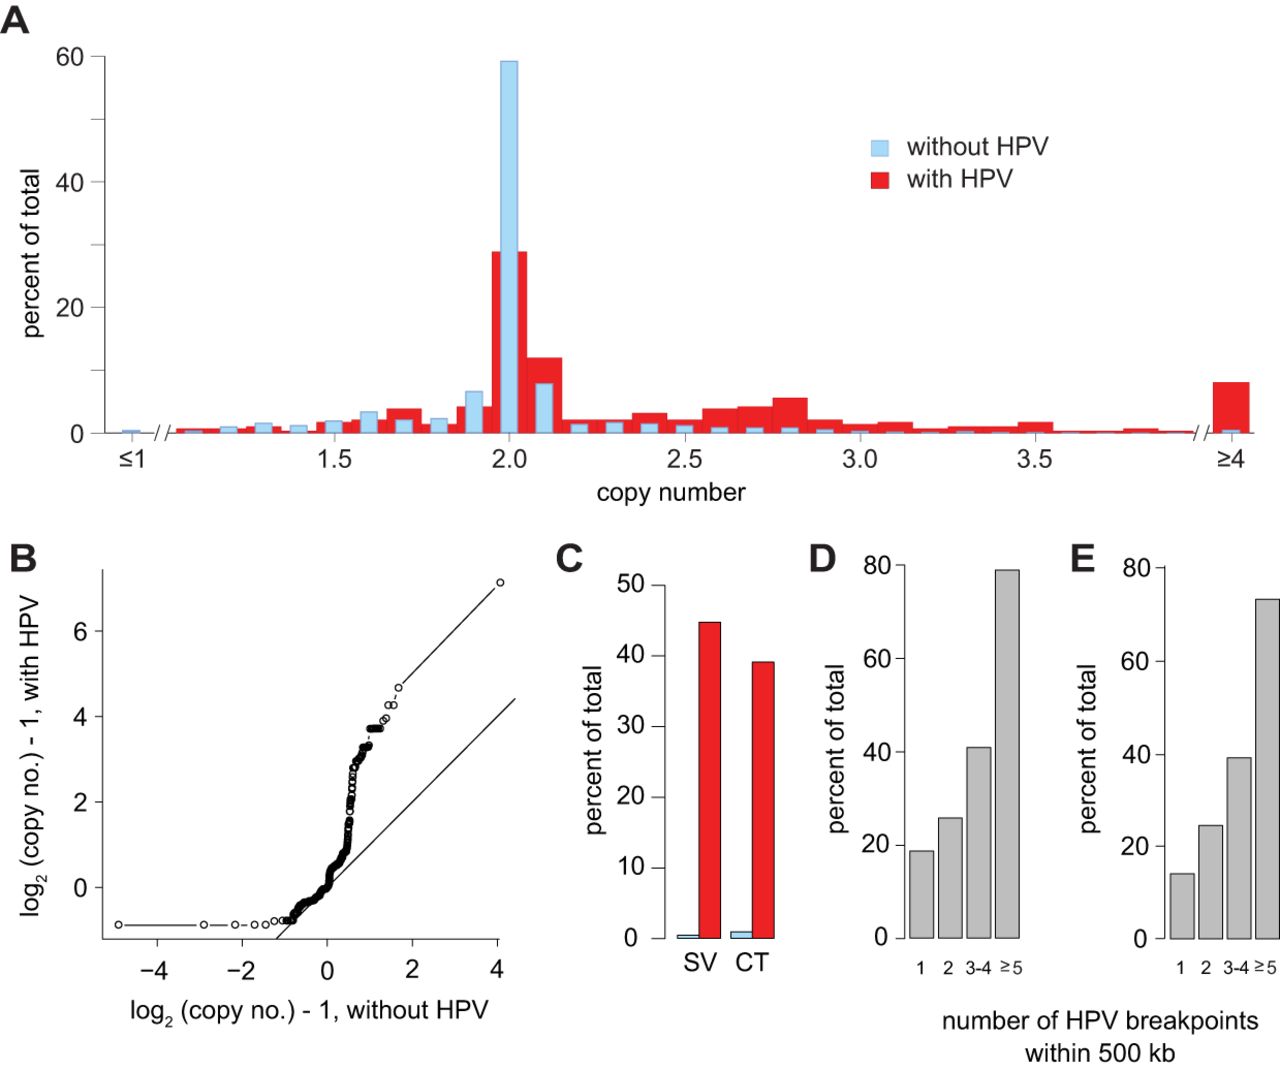
HPV integrants are associated with CNVs and SVs across tumors. (A) Shown are distinct frequency distributions (y-axis) of copy numbers (x-axis) of 100-kb genomic segments with (red) versus without (blue) virus–host breakpoints across 105 HPV-positive OPSCC (χ2, P = 1.8 × 10⁻¹⁸). (B) Quantile-quantile (Q-Q) plot confirms differences in copy numbers of genomic segments with (y-axis) and without (x-axis) breakpoints, deviating significantly from the line of identity (P < 2.2 × 10⁻¹⁶, Kolmogorov–Smirnov test). (C) Frequencies (y-axis) of structural variation (SV, left) and step-changes in copy number (copy number transition [CT] ±0.5 n, right) are significantly greater in 100-kb segments with a breakpoint (red) versus without (gray) (SV; binomial test, one-tailed, P = 3.3 × 10−224; CT, P = 2.39 × 10⁻¹⁴). (D,E) Among 500-kb genomic segments with ≥1 breakpoints, frequencies (y-axis) of (D) SVs and (E) CTs increase with breakpoint counts in the cluster. See also Supplemental Table S4.