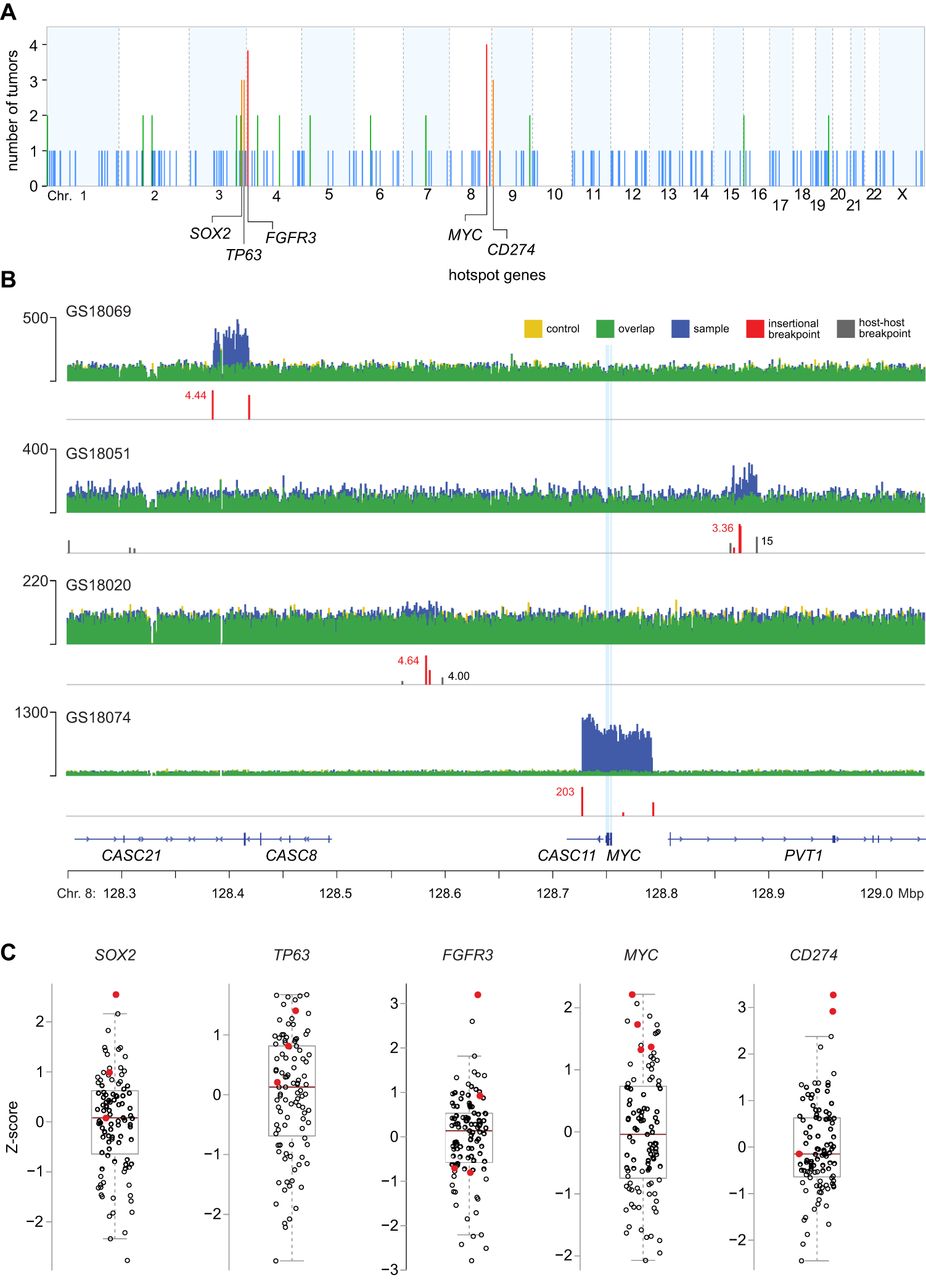
Genomic hotspots of integration near genes involved in epithelial stem cell maintenance and immune evasion. (A) Counts of independent tumors harboring ≥1 virus–host breakpoints (y-axis) in 1-Mbp genomic segments across the human genome (x-axis). Recurrent hotspots are identified at five segments containing SOX2, TP63, FGFR3, MYC, and CD274, each across at least three tumors (orange, n = 3 tumors; red, n = 4; empirical probability, P = 1 × 10⁻⁶). Other integration sites are not statistically significant hotspots in these tumors (blue, n = 1 tumor; green, n = 2). (B) IGV browser views of WGS depth of coverage (y-axis) and virus–host breakpoints (red) in four independent tumors within a 1-Mbp genomic segment containing MYC (x-axis; light blue vertical lines, exons). Colors as in key at top. Y-axis scale, tick mark, range (maximal count) of mapped WGS reads at locus in each tumor. See also Supplemental Figure S2.1. (C) Transcript levels of SOX2, TP63, FGFR3, MYC, and CD274 (y-axis, Z-score of log2 TPM value), in tumors quantified by RNA-seq (circles, n = 103). Red fill: tumors with breakpoints near the hotspot genes (panels A,B). Box and whiskers, median (brown horizontal line), quartiles (light gray box). See also Supplemental Figures S2.1, S2.2 and Supplemental Tables S2.1, S2.2.