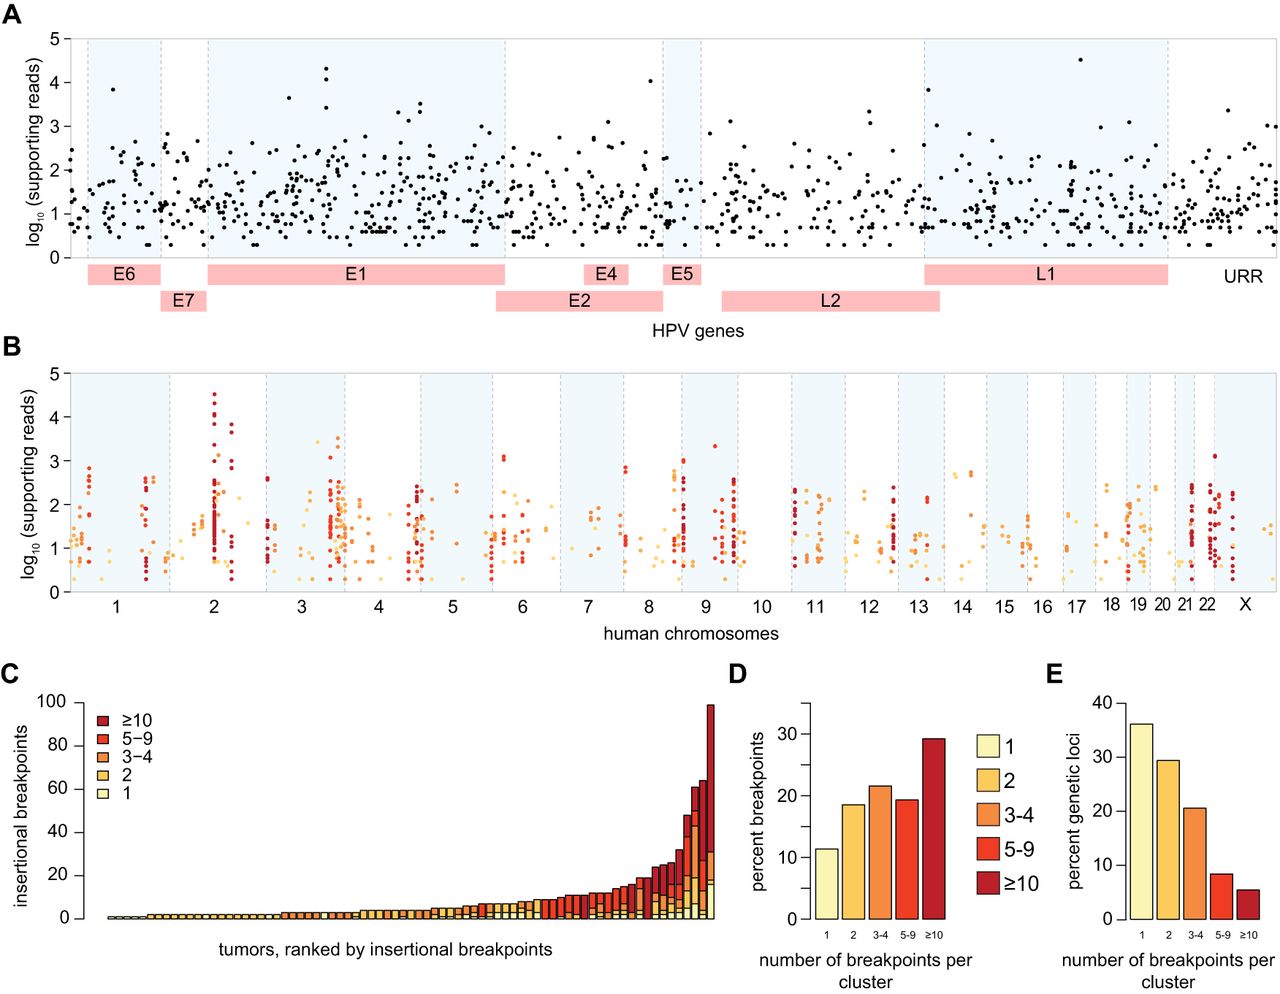
Frequent clustering of virus–host breakpoints in individual tumors. (A) Breakpoints (dots, n = 874) identified in 105 HPV-positive OPSCCs mapped to the HPV16 genome (x-axis). Non-HPV16 breakpoint (n = 50) coordinates are approximated; y-axis, log10 of WGS reads supporting each breakpoint. (B) Breakpoints uniquely mapped to the human genome (x-axis, n = 756, hg19) are clustered within 500-kb windows; y-axis as in A. Colors: breakpoints in individual tumors in clusters, as per key in panel C. (C) Counts of uniquely mapped breakpoints (y-axis), ranked by frequency in individual HPV-positive OPSCCs (x-axis). Colors: breakpoint counts per cluster. (D) Overall frequencies of breakpoints in clusters across all tumors (x-axis; colors, breakpoint counts per cluster). (E) Overall frequencies of distinct genetic loci harboring clusters of various breakpoint counts within 500 kb (x-axis) in individual tumors. See also Supplemental Figures S1.1–S1.6 and Supplemental Tables S1.1–S1.9.