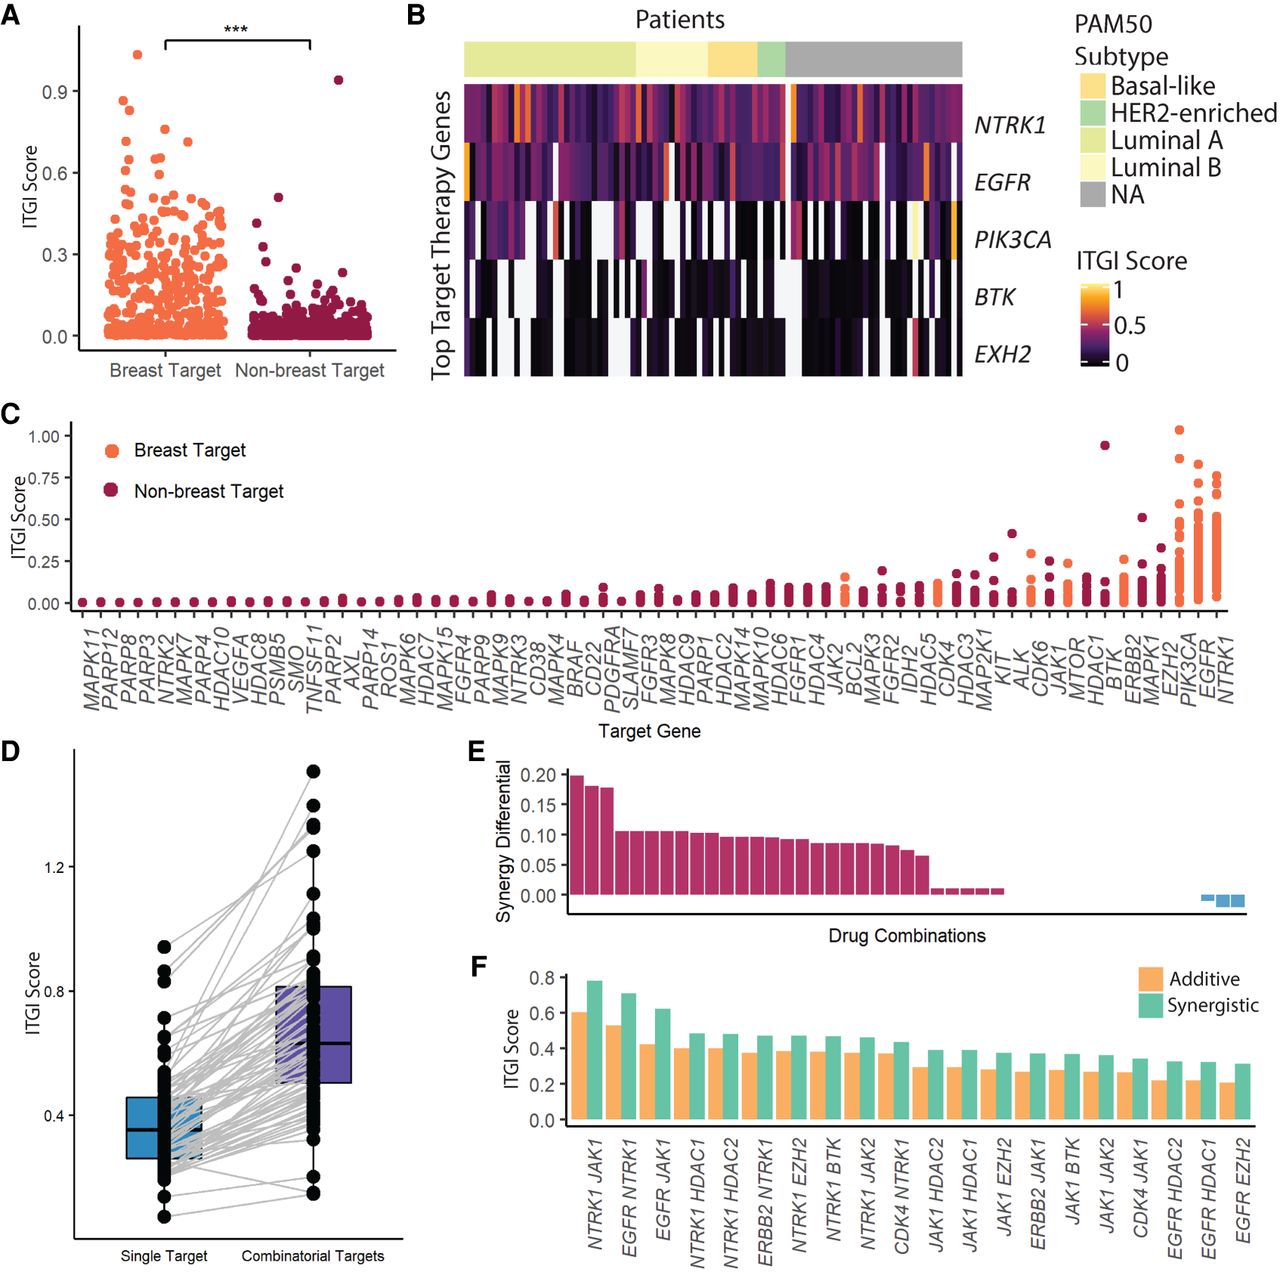
Figure 6.
Individualized disease modules for formulating singular and combinatorial individualized therapies. (A) Dot plot showing the target scoring for breast cancer versus nonbreast targets. (B) Heatmap of the highest-scoring gene targets. (C) Dot plots of targeting score for each target. (D) Paired boxplots showing the maximum single-target and maximum combinatorial target score. (E) Drug synergy differential (synergistic − additive) for this patient's therapeutic combinations. Red bars indicate positively synergistic combination; blue bars, negatively synergistic combination. (F) A single patient's top 10 combinatorial therapies scored simultaneously (synergistic) and additively removal.