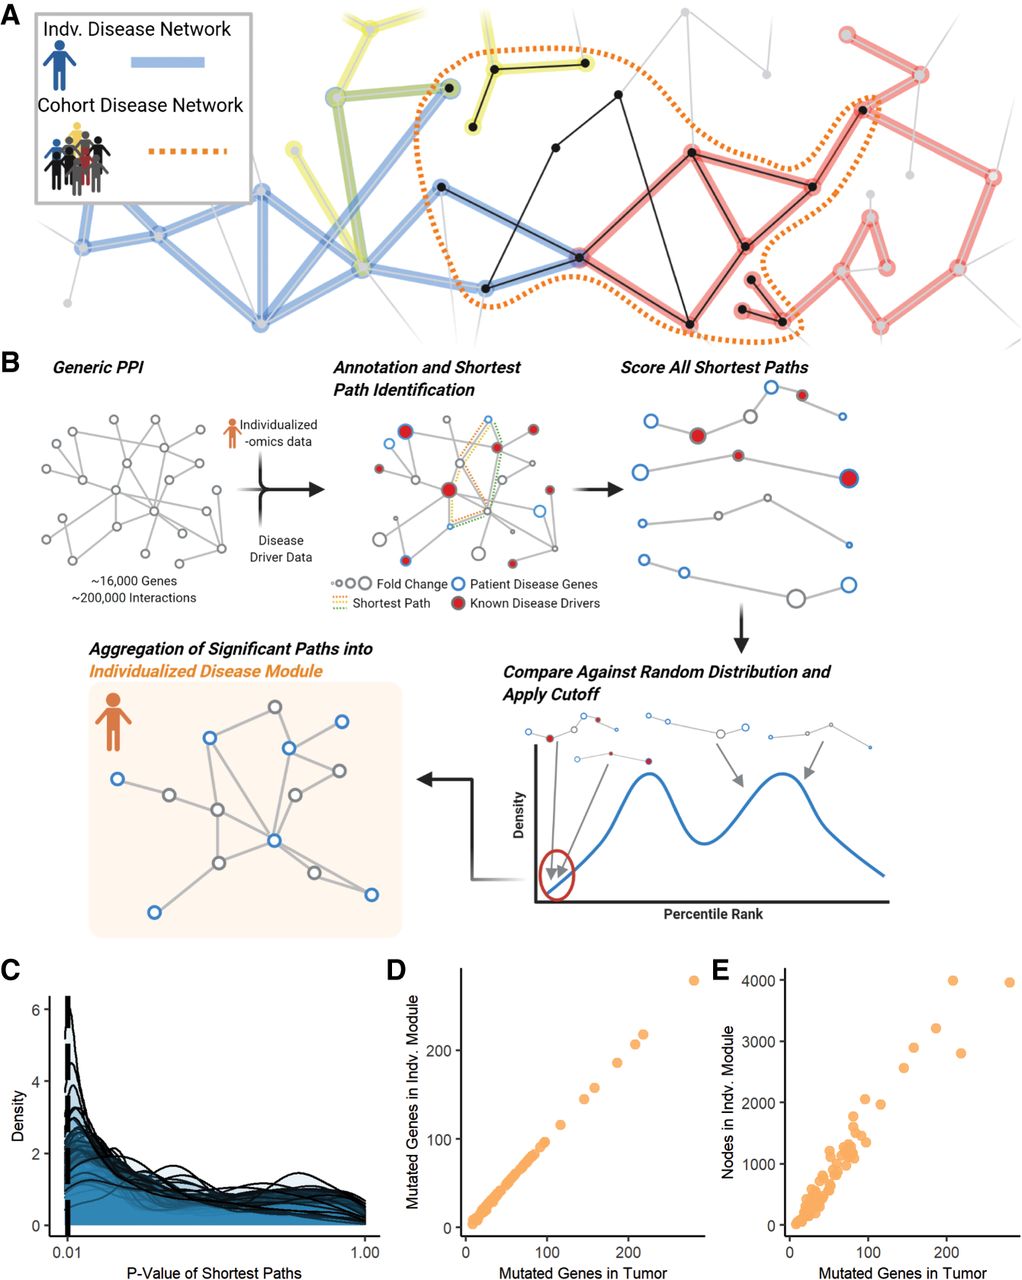
Individualized disease module concept and construction pipeline. (A) Schematic illustrating how individualized disease modules are related to cohort-inferred disease modules. (B) Our construction pipeline begins with annotation of a generic protein–protein interaction (PPI) network with disease-context and individualized omics data. Following annotation, all shortest paths between diseased genes are detected and evaluated for disease activity. These paths are compared with randomly generated pathways via empirical P-value. Pathways that are less than empirical P-values of 0.01 are added to the individualized disease modules. (C) Density plots displaying the distribution of P-values for each patient's real paths. (D,E) Scatter plot of the number of mutated genes (D) and nodes (E) in the individualized disease modules versus the number of mutated genes in the tumor.