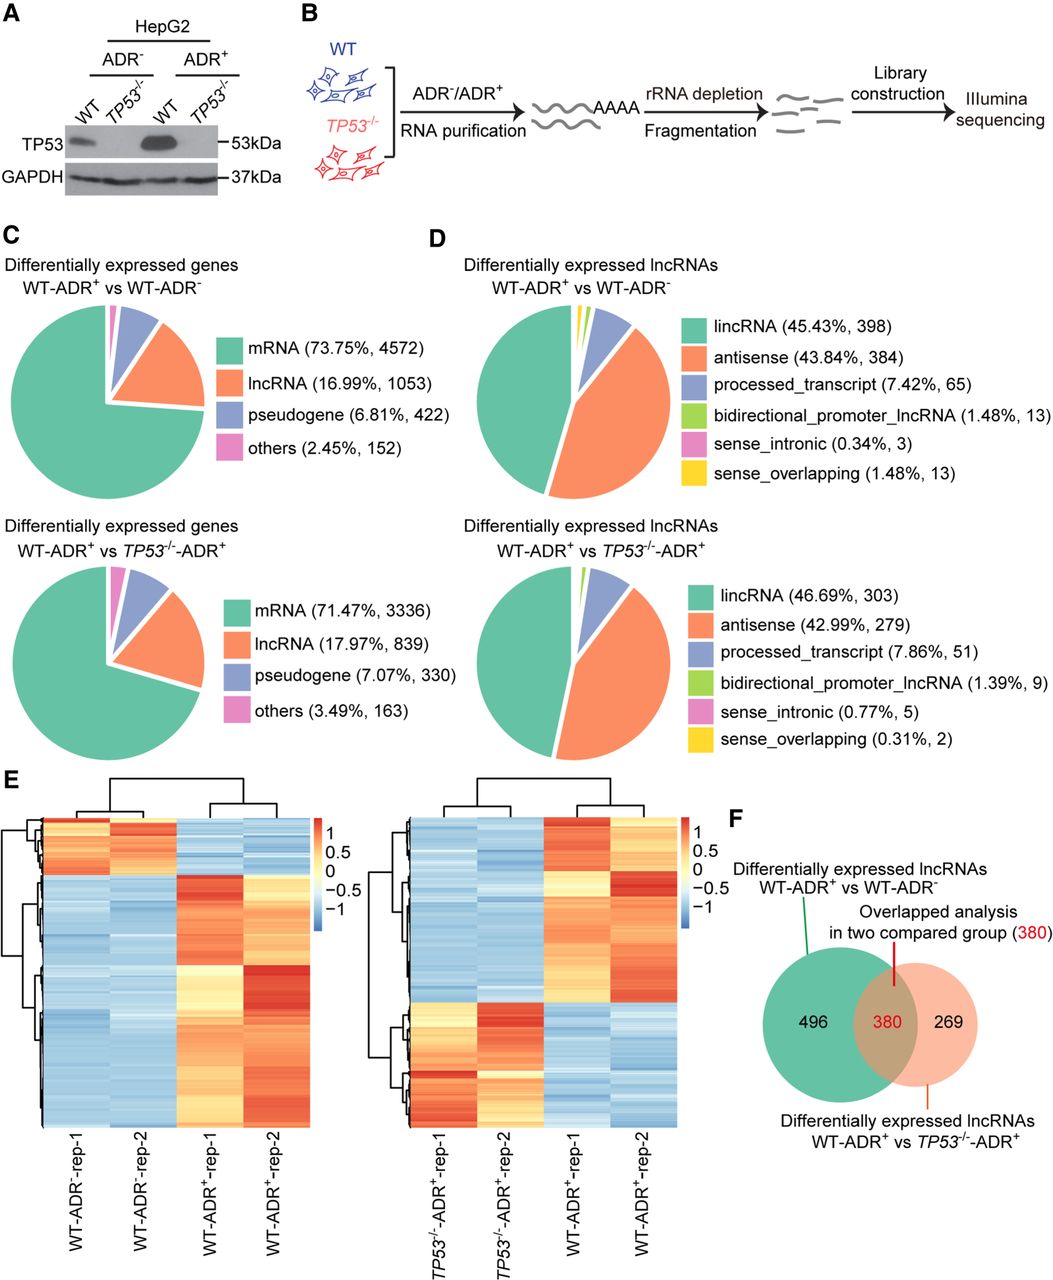
Genome-wide analysis of the differential transcriptomes of HepG2 cells and HepG2TP53−/− cells upon DNA damage. (A) The TP53 protein level in HepG2 and HepG2TP53−/− cells untreated or treated with ADR for 24 h. GAPDH is shown as the loading control for the samples. (B) Experimental model showing the treatment to the samples for RNA-seq. (C) Biotype distribution of the differentially expressed transcripts in the RNA-seq analysis. (Top) The comparison group between HepG2 cells treated or not treated with ADR for 24 h (WT-ADR+ vs. WT-ADR−). (Bottom) The comparison group between HepG2 cells and HepG2TP53−/− cells treated with ADR for 24 h (WT-ADR+ vs. TP53−/−-ADR+). (D) Biotype distribution of the differentially expressed lncRNAs in the two comparison groups above. (E) The heatmaps of the differentially expressed lncRNAs in the two comparison groups (left, WT-ADR+ vs. WT-ADR−; right, WT-ADR+ vs. TP53−/−-ADR+) across two replicates of HepG2 cells and HepG2TP53−/− cells with or without ADR treatment. (F) The Venn diagram showing the overlap of lncRNAs between the two groups above. The overlap lncRNAs represented TP53-dependent lncRNAs in response to DNA damage.