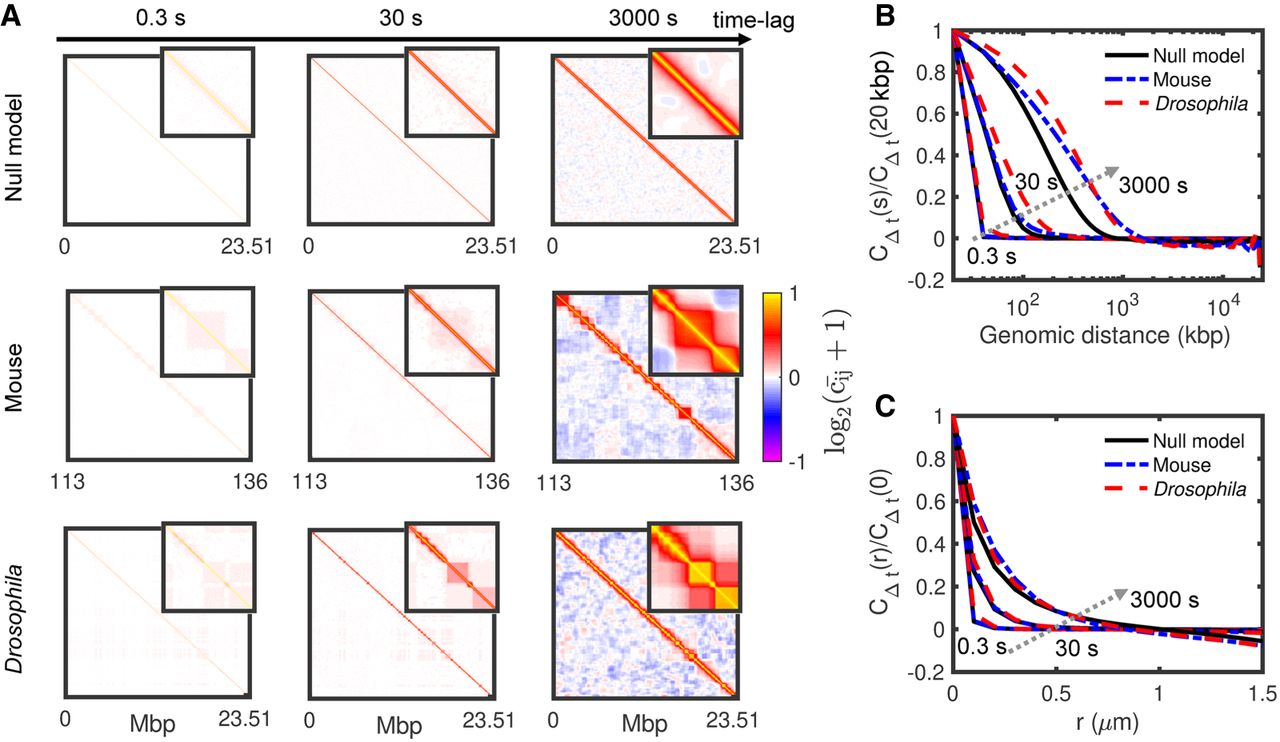
Figure 7.
Spatiotemporal correlations of loci displacements. (A) Normalized matrices of pair correlation of motions for the null model (top), mouse (middle), and Drosophila (bottom) at different time lags. Insets represent zooms of the 2 Mbp × 2 Mbp central parts of the matrices. (B,C) Normalized average correlations as a function of the genomic distance (B) and spatial distance (C) for the time lags displayed in A. Arrows indicate increasing time lag.