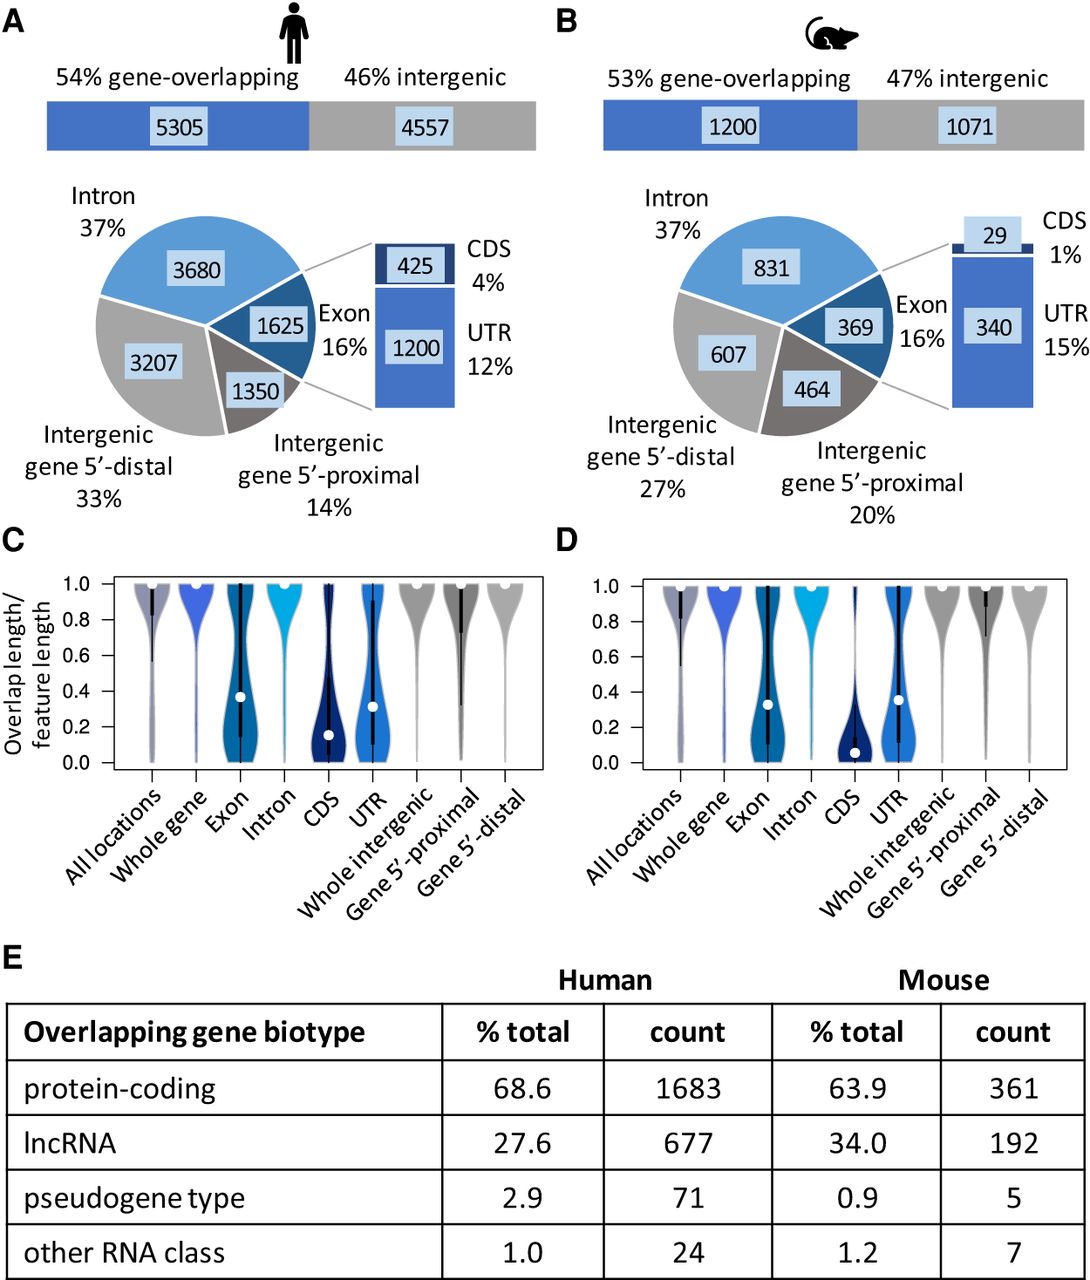
Locations of RefSeqFE features relative to genes. (A) Locations of features from human AR 109.20201120 compared to NCBI-annotated genes and subparts from the same AR. The horizontal bar graph shows the overall locations (gene-overlapping or intergenic), whereas the bar-of-pie chart shows more detailed locations. Blue tones denote genes and subparts, and gray tones denote intergenic regions. The pale blue labels indicate overlapping feature counts for each location, as shown for called overlaps in Supplemental Table S3A. (B) Locations of features from mouse AR 109 as shown for human in A. (C) Violin plot showing completeness of human RefSeqFE feature overlaps (overlap length/RefSeqFE feature length) at each gene-relative location (blue- and gray-tone coloring as in A) and cumulative results for all locations (blue-gray distribution at left): n = 25,029, 5468, 2084, 4373, 743, 1735, 5235, 1906, and 3485 sample points. Supporting statistics (Fisher P-values, Jaccard statistics, degree of overlap minimums, maximums, averages, and standard deviations) are provided in Supplemental Table S3A. (D) Violin plot showing completeness of mouse feature overlaps at each gene-relative location as described for human in C: n = 5810, 1249, 502, 981, 97, 459, 1237, 578, and 707 sample points. Supporting statistics are provided in Supplemental Table S3A. (E) Biotype statistics for genes that are overlapped by RefSeqFE features. The count columns indicate the number of distinct genes overlapped by one or more features, whereas the percentage total columns indicate percentages of the total number of genes (2455 human, 565 mouse) overlapped by RefSeqFE features for each biotype.