Figure 3.
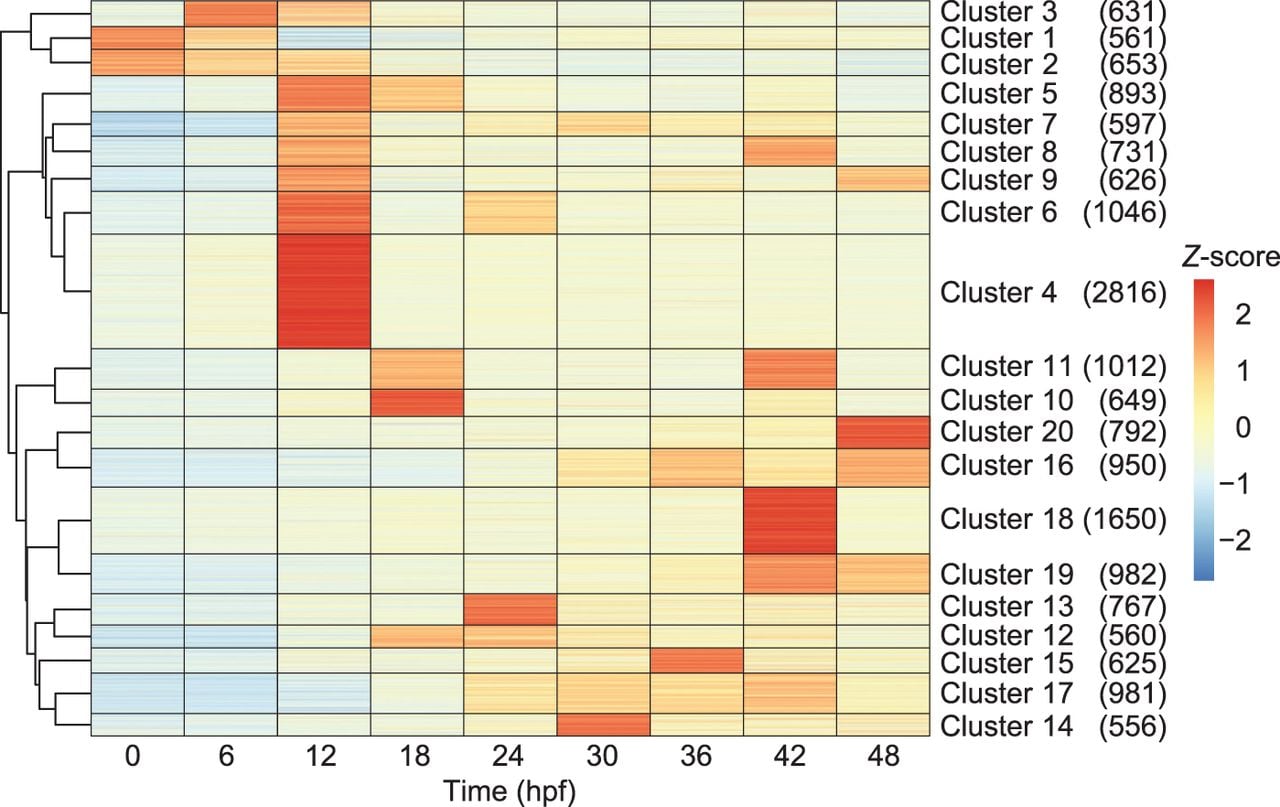
Heatmap based on k-means clustering (K = 20) of eRNA temporal expression profiles. The number of eRNAs in each cluster is shown in parentheses.
Heatmap based on k-means clustering (K = 20) of eRNA temporal expression profiles. The number of eRNAs in each cluster is shown in parentheses.