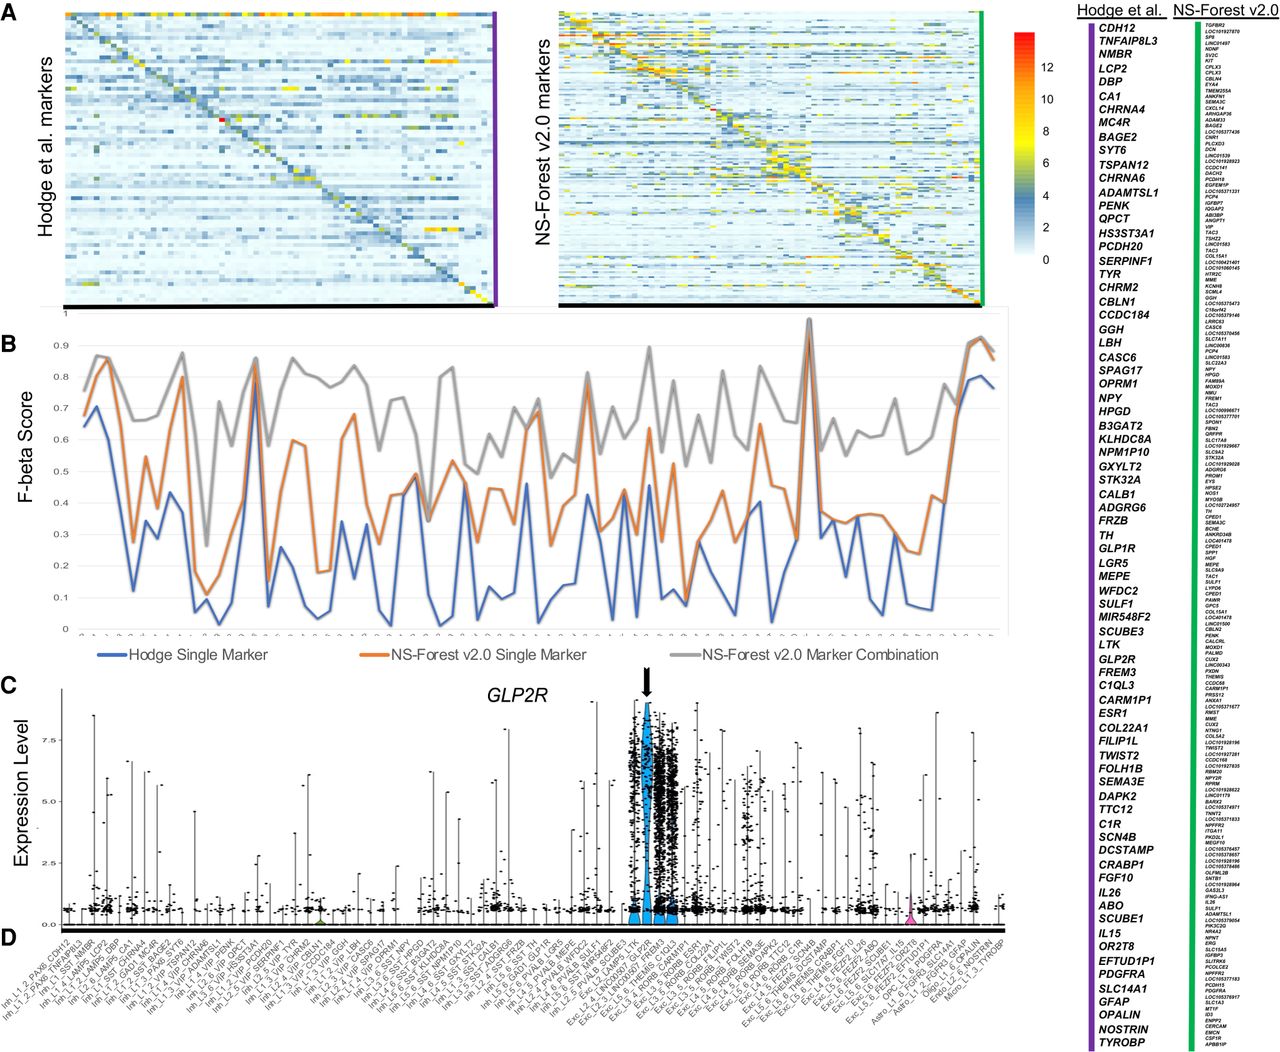
Figure 5.
Comparison of Hodge et al. (2019) markers with NS-Forest v2.0 for the full MTG. (A) Unscaled heat map for both sets of markers where the values are the mean expression per gene. (B) F-beta scores (y-axis) for the single Hodge marker gene (blue), the best NS-Forest single marker gene (orange), and the combination of marker genes found by NS-Forest (gray). (C) An example violin plot of a binary expression pattern selected by the method used by Hodge et al. (2019) for cluster Exc_L2_4_LINC00507_GLP2R, with expression given as log2 CPMs. For all panels, cell type clusters are listed along the x-axis in taxonomic order. (D) Taxonomy ordered labels corresponding to the x-axis of the heat maps in A and also the violin plot in C.