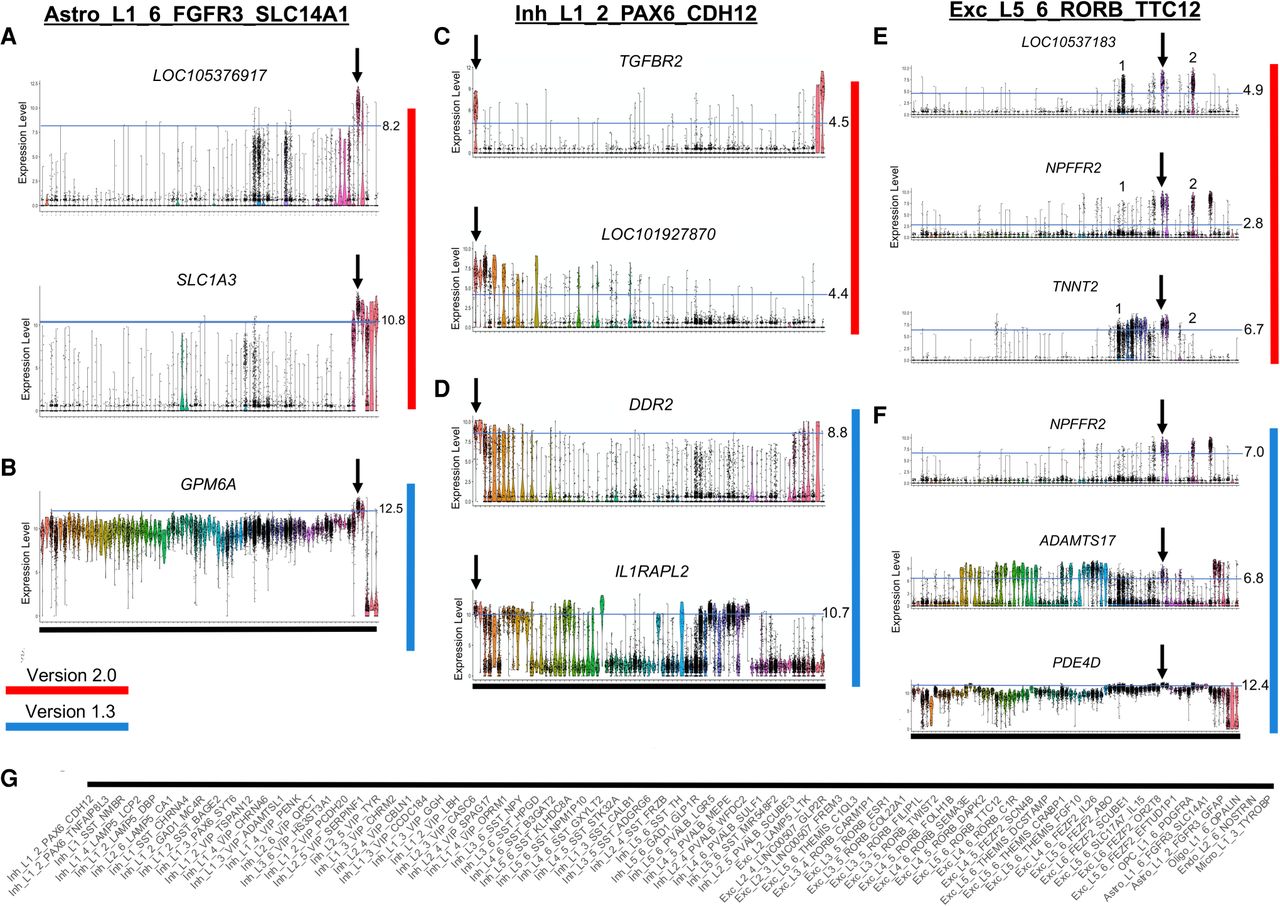
Marker gene expression for representative cell type clusters of the three major taxonomy classes: nonneuronal, inhibitory neurons, and excitatory neurons. Panels A, C, and E (red) show markers determined by NS-Forest v2.0; panels B, D, and F (blue) show markers from NS-Forest v1.3. Expression level violin plots are log2 CPMs with cell types enumerated along the x-axis in taxonomic order. Expression thresholds are demarcated by light blue lines and cutoff values are given on the right. Thresholds for NS-Forest v2.0 were determined by decision tree split points, whereas, for NS-Forest v1.3, they were fixed for a given gene at the expression level where 75% of cells had expression within the target cluster. (G) Taxonomy ordered labels corresponding to the x-axis of all violin plots.