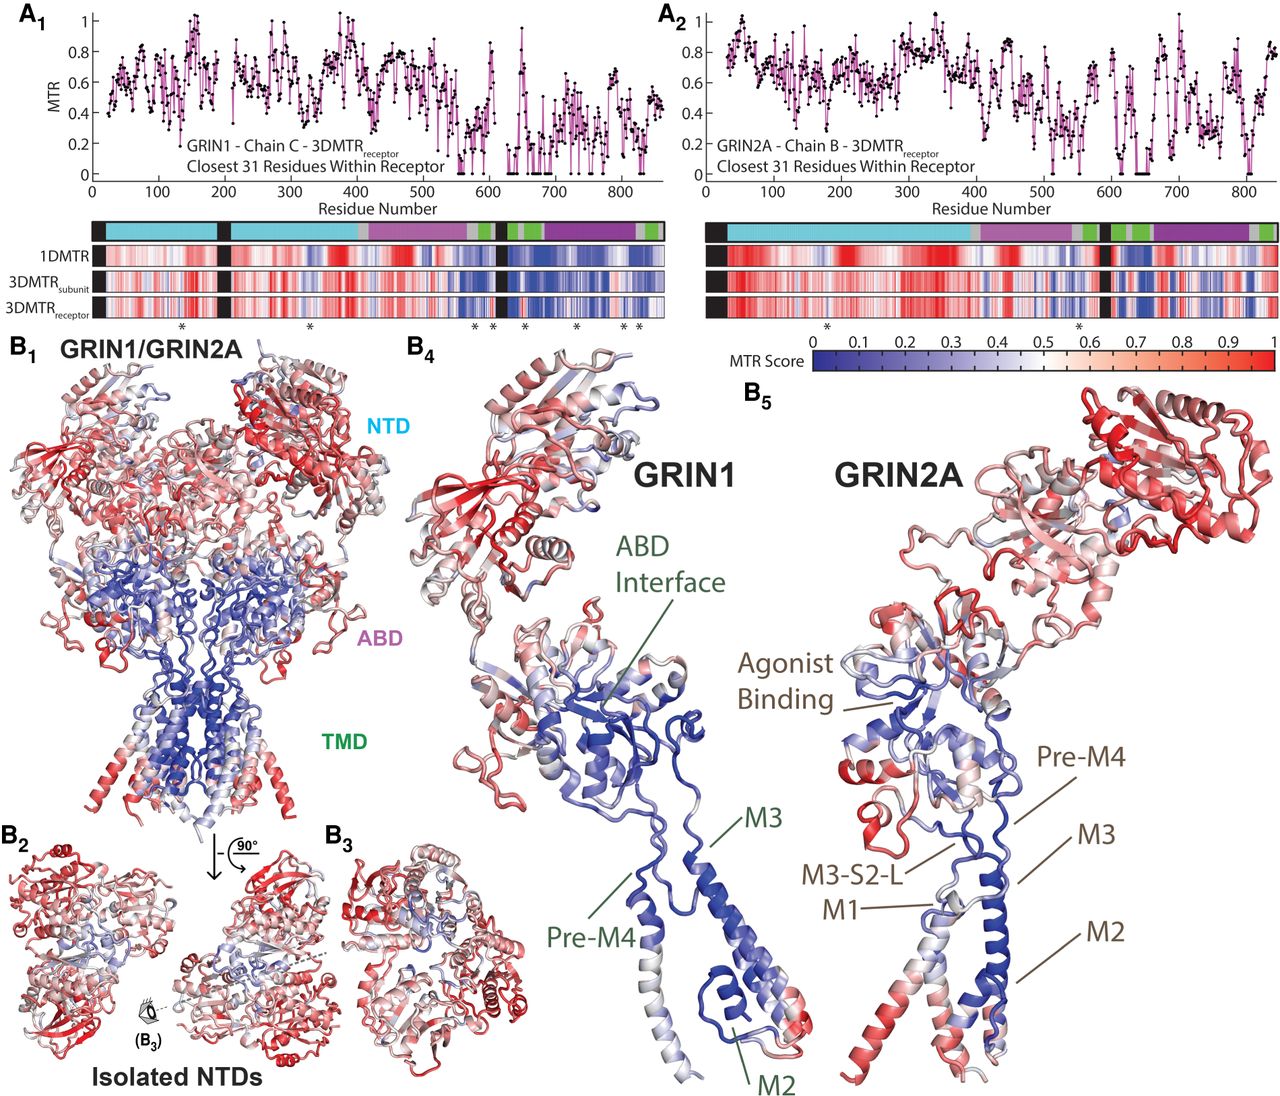
Figure 5.
3DMTR intra-receptor score of GRIN1/2A. (A) Scatter plots of the GRIN1 (A1) and GRIN2A (A2) 3DMTR (intra-receptor) score. (Below) Raster plots of each subunit's 1DMTR, 3DMTR intra-subunit, and the 3DMTR intra-receptor scores. (*) Primary differences between the intra-subunit and intra-receptor 3DMTR scores. (B) Structural heatmap views showing the 3DMTR (intra-receptor) score on the full receptor (B1), a top down view of the four isolated NTDs of the receptor (B2), a side view of one NTD dimer (B3); one of the GRIN1 (B4) and GRIN2A (B5) subunits are shown in isolation. All raster plots and structural heatmaps use the same color bar, shown at the top right of B5.