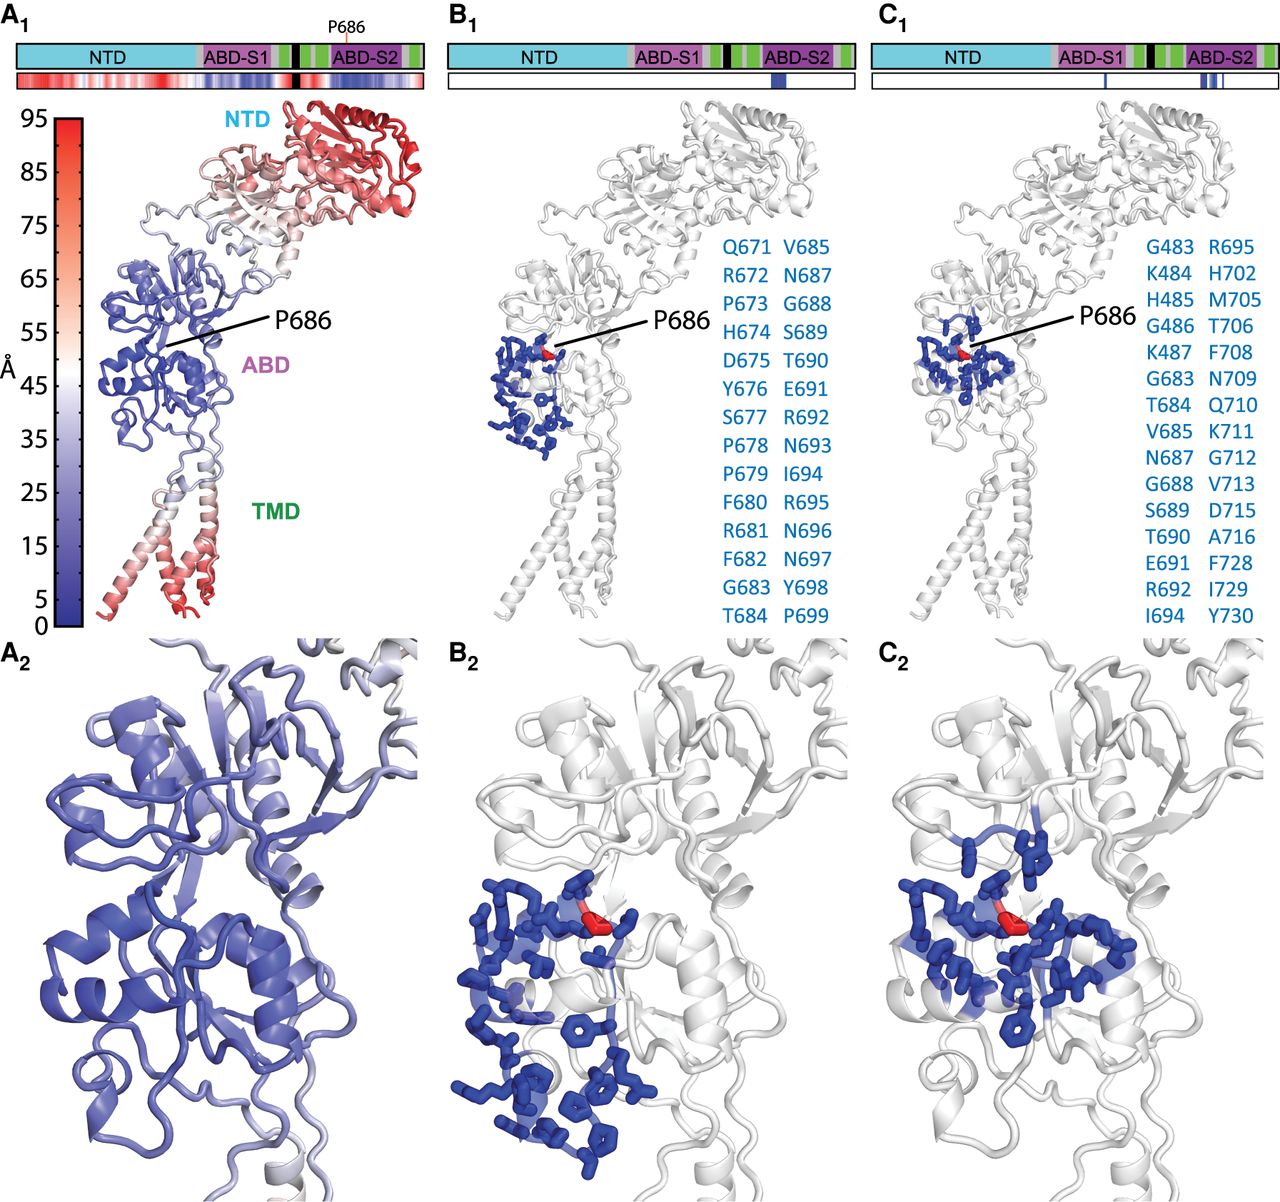
Figure 2.
GRIN2A comparison of the closest residues as determined by sequence (1D) or inter-residue distances (3D). (A) Residue distances from Pro686. (A1) A linear heatmap raster plot and heatmap showing the distance of all residues in the GRIN2A subunit to residue Pro686. (A2) A closer view of the ABD in A1. (B) Closest 31 residues (1D) to Pro686. (B1) A linear raster plot and structural view of the 31 sequentially closest (1D) residues (blue) to Pro686 (red), with the side chains depicted by sticks. (B2) A closer view of the ABD in B1. (C) Closest 31 residues (3D) to Pro686. (C1) A linear raster plot and structural view of the 31 closest (3D) residues (blue) to Pro686 (red), side chains depicted by sticks. (C2) A closer view of the ABD in C1.