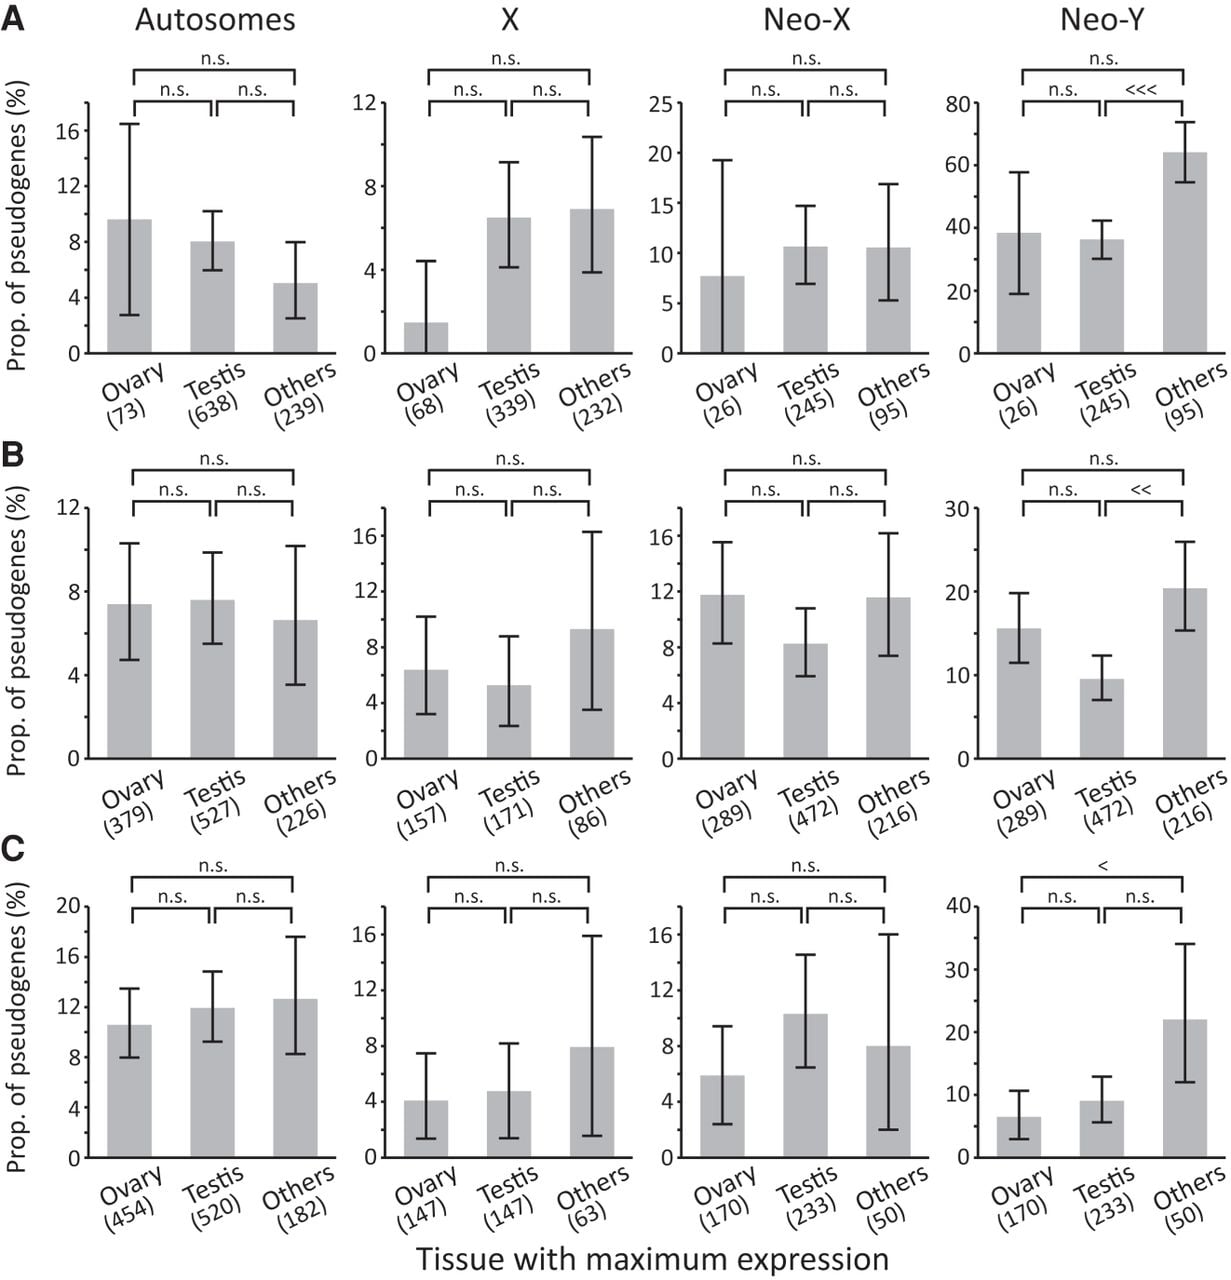
Relationship between spatiotemporal gene expression pattern and pseudogenization. All genes were classified into three groups based on the tissue with the highest expression in Drosophila pseudoobscura (A), D. nasuta (B), and D. texana (C), closely related species of D. miranda, D. albomicans, and D. americana, respectively, based on cFPKM values. To remove genes with similar cFPKM in multiple tissues, only genes with at a difference in cFPKM of at least twofold between a particular tissue and other tissues examined were included. Orthologs regarded to be functional in the close relatives (D. pseudoobscura and D. obscura for D. miranda, D. nasuta and D. kohkoa for D. albomicans, and D. texana and D. novamexicana for D. americana, respectively) and located on the same Muller element without any inparalogs were used for this analysis. Number of genes in each category is shown in parenthesis. Error bars show the 95% confidence interval based on a bootstrap resampling with 10,000 replicates. Statistical significance between groups was tested by Fisher's exact test with correction for multiple testing: (<<<) Q < 0.001; (<<) Q < 0.01; (<) Q < 0.05; (n.s.) Q ≥ 0.05.