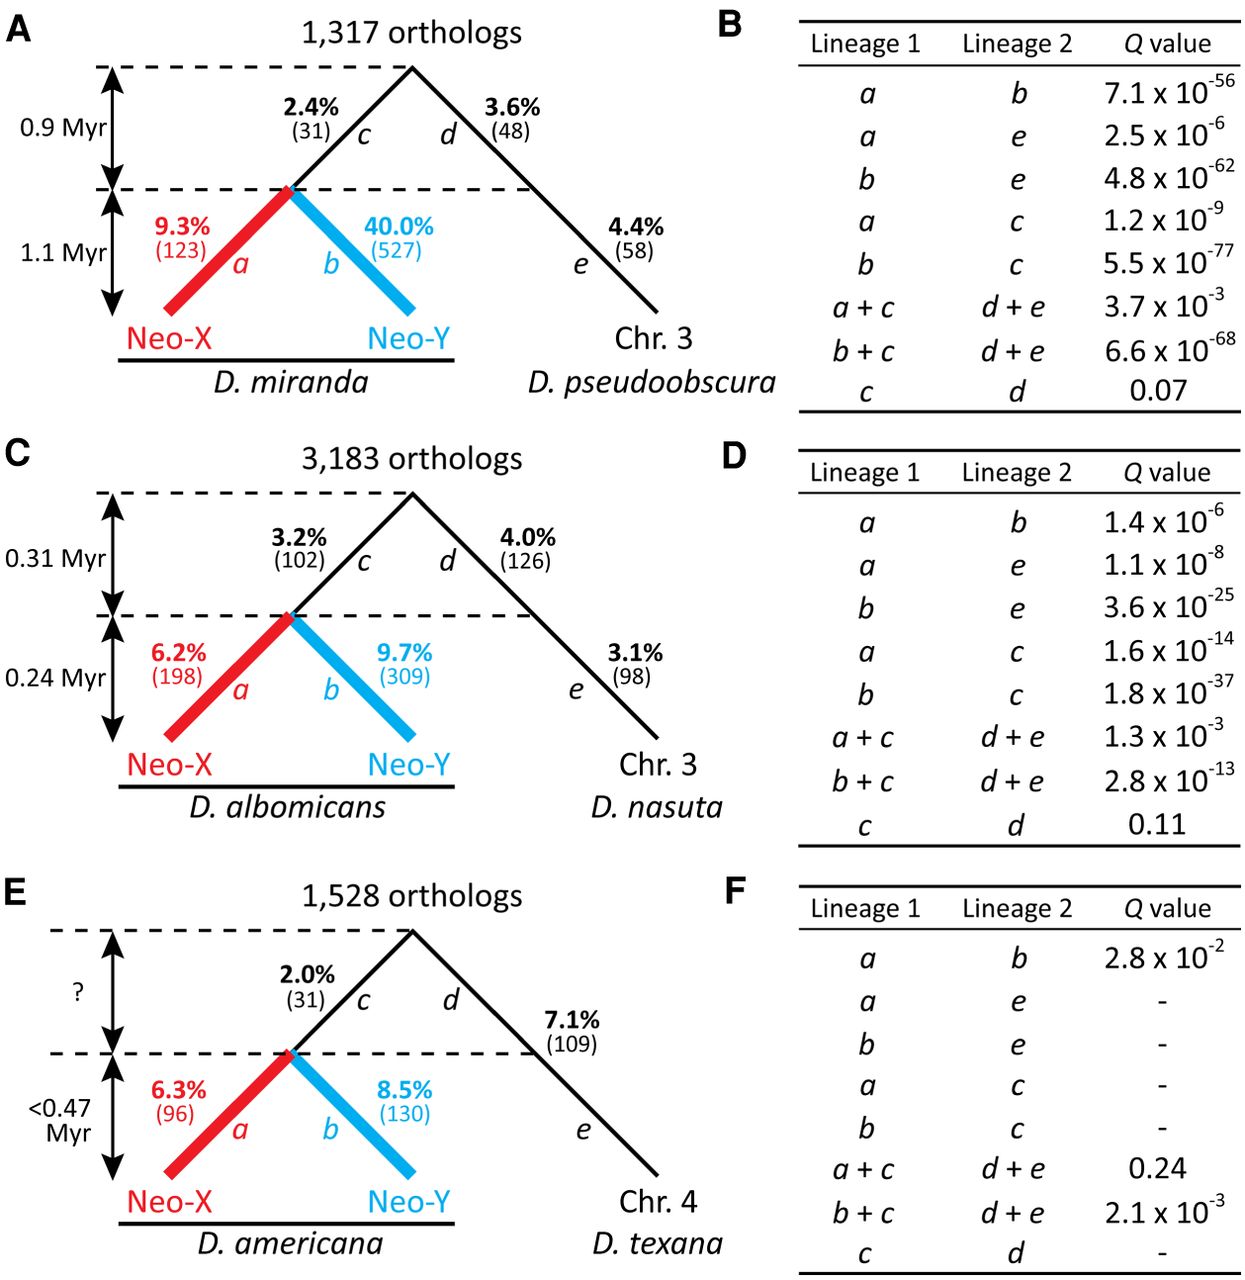
Pseudogenization events before and after neo-sex chromosome emergence. (A,C,E) Proportions of genes that were pseudogenized in Drosophila miranda (A), D. albomicans (C), and D. americana (E) lineages compared with those in the corresponding closely related species. Numbers in parentheses indicate the number of pseudogenized genes in each lineage. Orthologs regarded as functional in the outgroup species (D. obscura, D. kohkoa, and D. novamexicana, respectively) and located on the same Muller element without any inparalogs were used for this analysis. The number of such orthologs is shown above each tree. (B,D,F) Analysis of differences in the pseudogenization rate between lineages of D. miranda (B), D. albomicans (D), and D. americana (F) by a χ2 test with correction for multiple testing under the null hypothesis of equal pseudogenization rates between lineages. Lineages a to e correspond to the branches in A, C, and E.