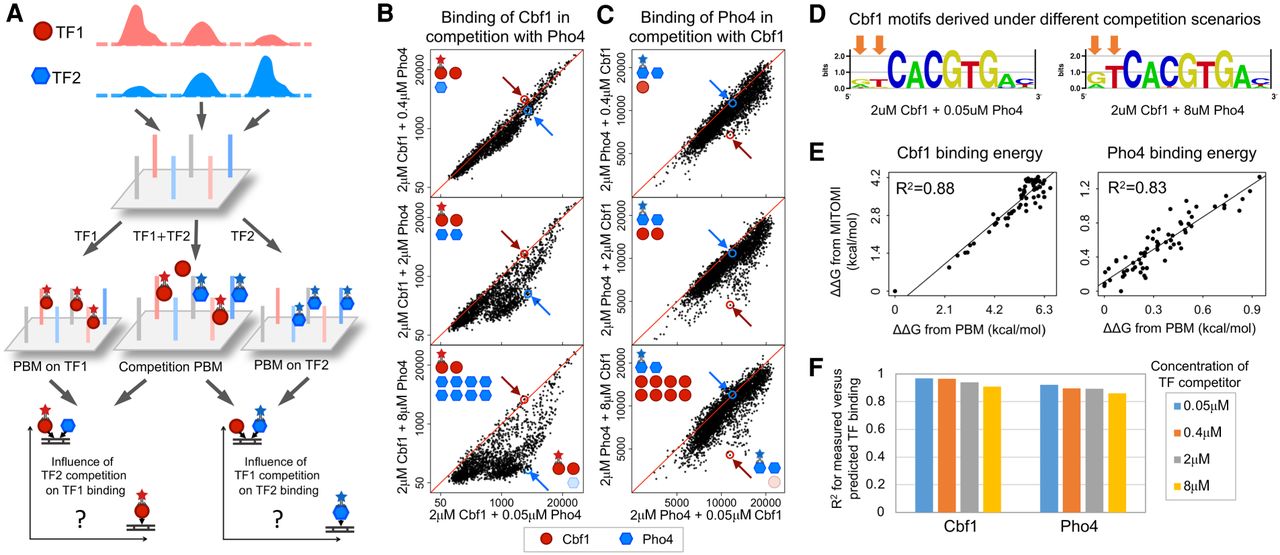
Characterizing the DNA-binding patterns of Cbf1 and Pho4 using “competition PBM.” (A) Schematic of the competition PBM assay. Genomic DNA sites are selected from the ChIP-seq peaks of the TFs of interest and synthesized on a DNA chip, similarly to previous work (Siggers et al. 2011; Shen et al. 2018). The chip is then incubated with the TF paralogs of interest, alone or in competition, and the binding is quantified using fluorophore-conjugated antibodies. The effects of TF-TF competition are then quantified by comparing the binding of one TF under conditions where the concentration of the competitor is varied. See Methods for details. (B) DNA-binding levels for TF Cbf1, at 2 μM concentration, in competition with Pho4 at increasing concentrations: 0.05 μM (x-axis), 0.4 μM, 2 μM, and 8 μM (y-axes). The condition shown on the x-axis (which includes Pho4 at the low concentration of 0.05 μM) mimics the in vivo environment in rich media, where Pho4 levels in the nucleus are very low but still detectable (Schneider et al. 1994; O'Neill et al. 1996; Zhou and O'Shea 2011). Each of the 2014 data points corresponds to a putative Cbf1 binding site (defined as a site with Cbf1 binding intensity above negative controls) (Methods) in its native genomic sequence context. All sequences tested are 36 bp long, centered at the binding site. Data points below the diagonal demonstrate the influence of Pho4 competition, which results in decreased Cbf1-DNA binding. Blue circles and arrows point to a genomic site where Cbf1 binding decreases significantly with increasing Pho4 levels. Red circles and arrows point to a genomic site where Cbf1 binding is not significantly affected by increasing Pho4 levels. Data and statistics are available in Supplemental Table S2. (C) Similar to panel B but for Pho4 as the main TF and Cbf1 as the competitor TF. Each of the 3341 data points corresponds to a putative Pho4 binding site (defined as a site with Pho4 binding intensity above negative controls) (Methods). Red circles and arrows point to a genomic site where Pho4 binding decreases significantly with increasing Cbf1 levels. Blue circles and arrows point to a genomic site where Pho4 binding is not significantly affected by increasing Cbf1 levels. See also Supplemental Table S2. (D) Motif logos for Cbf1 derived from competitive binding data. Arrows mark the positions that are most different between the two motifs. See Supplemental Figure S2D for motifs derived from additional competitive binding conditions. (E) Comparing PBM-derived binding energies (ΔΔG) with binding energies derived from independent MITOMI experiments (Maerkl and Quake 2007). Each data point corresponds to one DNA sequence used in the MITOMI DNA libraries (the CACNNN library for Cbf1, where the lowest binding energy corresponds to CACGTG; and CACGTGNNN library for Pho4) (Methods; Maerkl and Quake 2007). See Supplemental Figure S4B for comparisons using additional MITOMI sequence sets. (F) Prediction accuracy for the biophysical model of competitive DNA binding by Cbf1 and Pho4. Bar plot shows the squared Pearson's correlation coefficients (R2) between measured and predicted binding levels at various concentrations of competitor. See Supplemental Figure S4F for full comparisons.