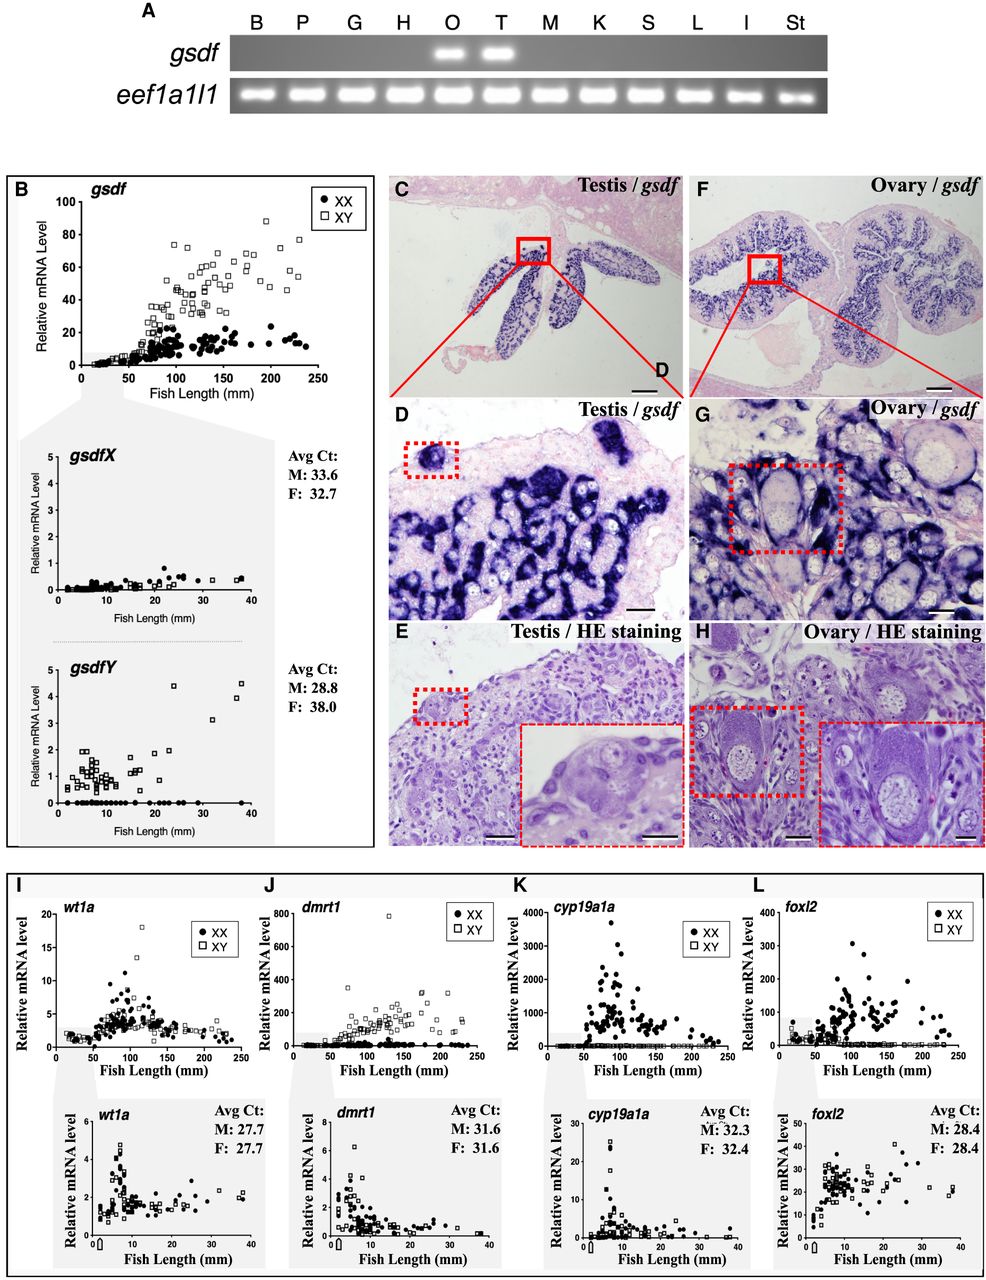
Temporal and spatial expression of gsdfX, gsdfY, and other early gonadal sex marker mRNAs in male and female developing gonads of sablefish. (A) Semiquantitative tissue distribution of gsdf (assay targeting both gsdf variants) in brain (B), pituitary (P), gill (G), heart (H), ovary (O), testis (T), muscle (M), kidney (K), spleen (S), liver (L), intestine (I), and stomach (St). Transcript levels of eef1a1l1 were assessed to verify quality and loading of cDNAs. (B) Ontogenetic gene expression profiles of gsdfX and gsdfY sex-specific allelic variants during early gonadal primordium development and sex differentiation in genotypic female (XX) and male (XY) sablefish. The upper panel in B shows gonadal gsdf expression (nonvariant specific assay) during ontogenetic development. The lower panel (gray shaded) shows gene expression results for assays targeting both X and Y Chromosomal transcripts during early larval development. (C–H) In situ hybridization (ISH) localization of gsdf mRNA in juvenile sablefish gonads. (C,D) ISH, (E) hematoxylin/eosin (HE) staining of sablefish testes. (F,G) ISH, (H) HE staining of sablefish ovaries. (I–L) Ontogenetic expression profiles for wt1a, dmrt1, cyp19a1a, and foxl2, across early gonadal development between genotypic females and males. (B,I–L) Filled circles denote XX-genotype fish and open squares denote XY-genotype fish. See Hayman et al. (2021) for additional detail on gonadal gene expression data. Scale bars: C, F, 200 µm; D, G, E, and H, 20 µm; inserts in E and H, 10 µm. See also Supplemental Data S1 for raw data.