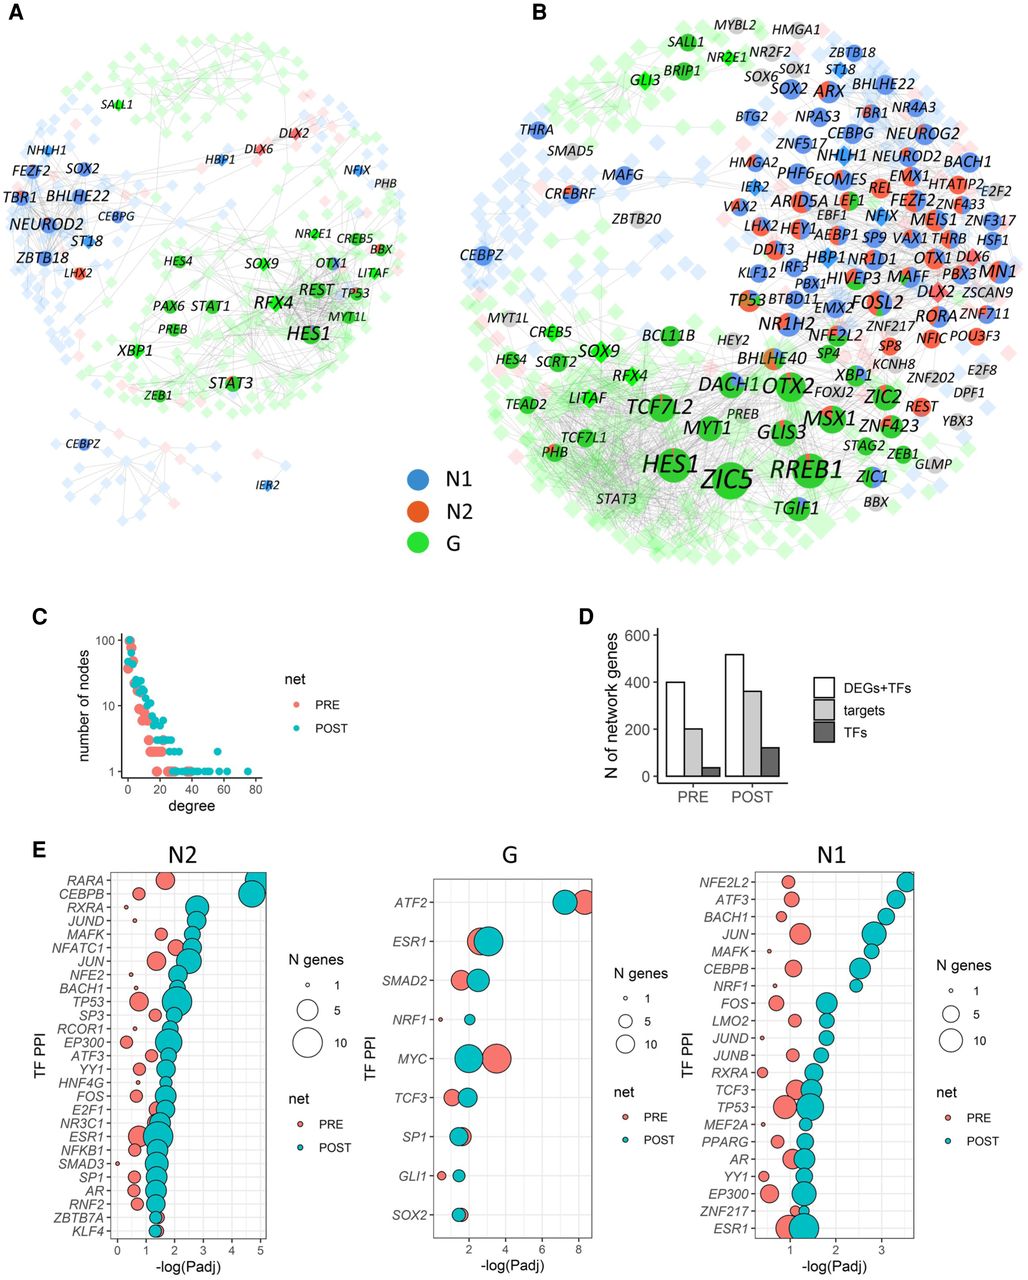
TF scCapture-seq improves gene regulatory networks. The networks of coexpressed pre-capture genes with (B) or without (A) imputed post-capture TFs. Only genes that are differentially expressed between three cell groups are shown. The TF nodes are labeled, with node sizes reflecting their degree on the whole network. TF nodes that are differentially expressed post-capture are shown as embedded pie charts, with colors corresponding to the proportion of DEGs neighbors from each of the three cell types. TFs that are not connected to cluster DEGs are gray. TFs that are also pre-capture DEGs are shown by brighter colored squares. (C) Distribution of network degree between nodes in pre-capture and post-capture imputed networks. (D) Total numbers of genes (DEGs + TFs), TFs, and TF targets present on the pre-capture and post-capture-imputed networks. (E) Enrichment of the cluster subnetworks in TF PPIs (TF networks), for pre-capture (PRE) and imputed (POST) networks. The circle sizes show the number of genes in each TF PPI term.