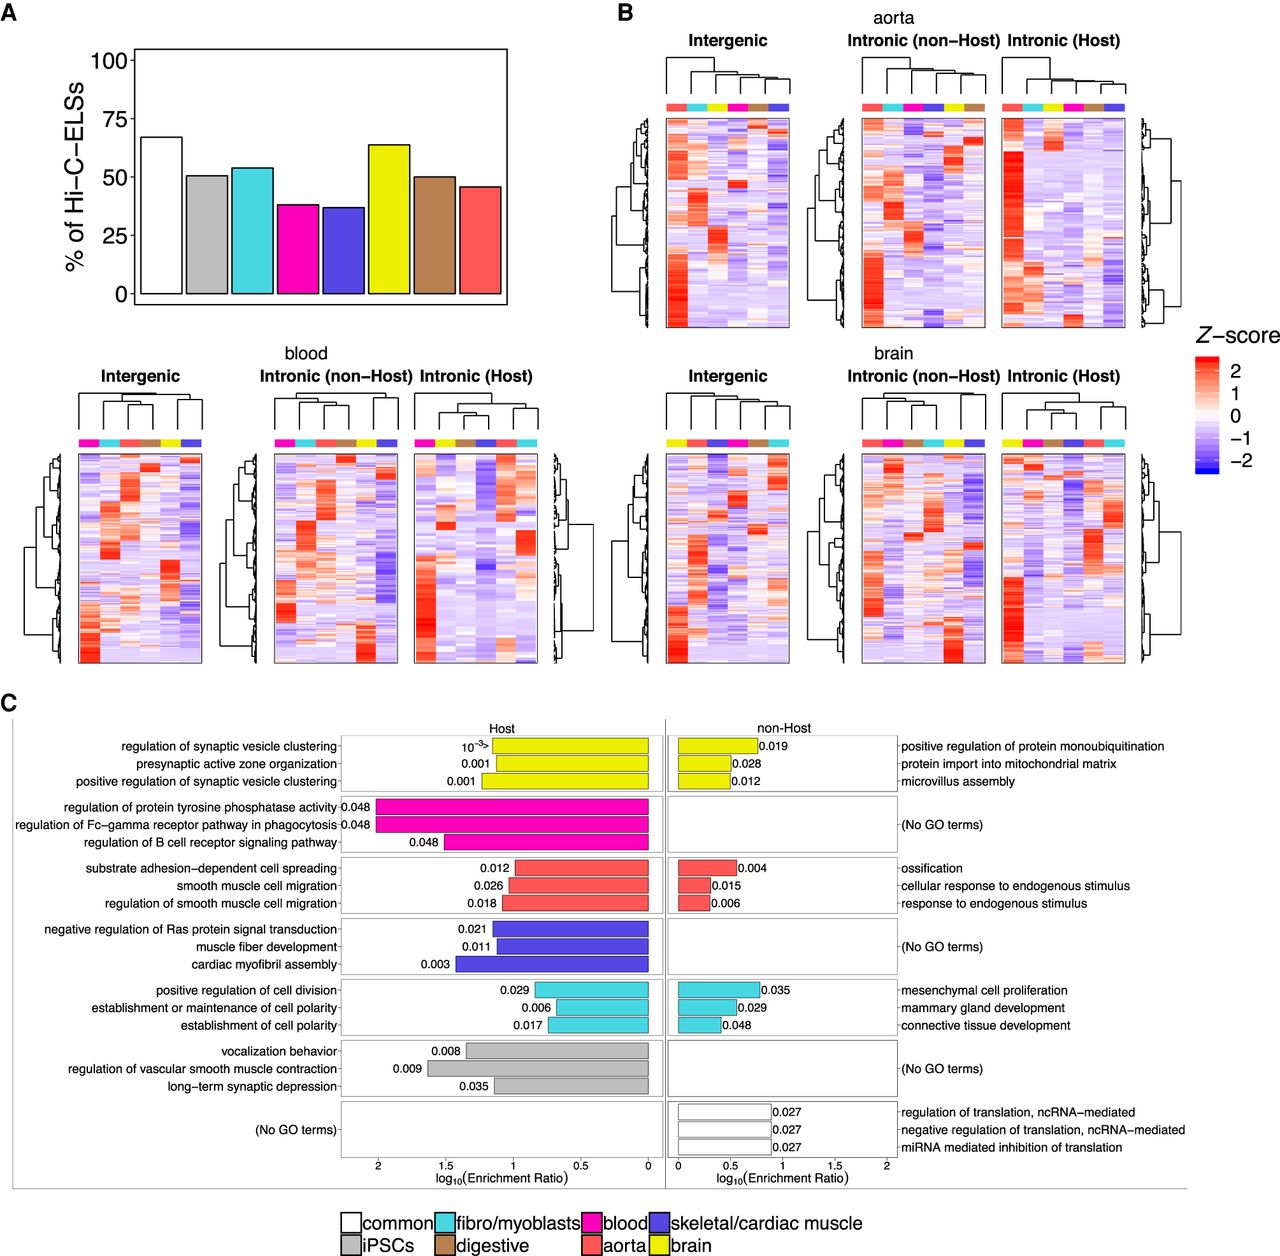
Intronic enhancers regulate hosting and non-hosting genes. (A) Proportions of Hi-C-ELSs that target their host gene. These proportions were calculated over the total amount of intronic Hi-C-ELSs within each cluster. (B) Z-score normalized median gene expression levels, across GTEx tissue categories, of the genes targeted by intergenic and intronic Hi-C-ELSs. Intronic Hi-C-ELSs are distinguished between those targeting their host gene (Host) and those that target a gene outside their hosting region (non-Host). Dendrograms show the hierarchical clustering of target genes (rows) and GTEx tissue categories (columns). (C) Top three significantly enriched GO terms found in the genes targeted by host and non-host intronic Hi-C-ELSs. P-values (FDR corrected) are shown for each enriched term.