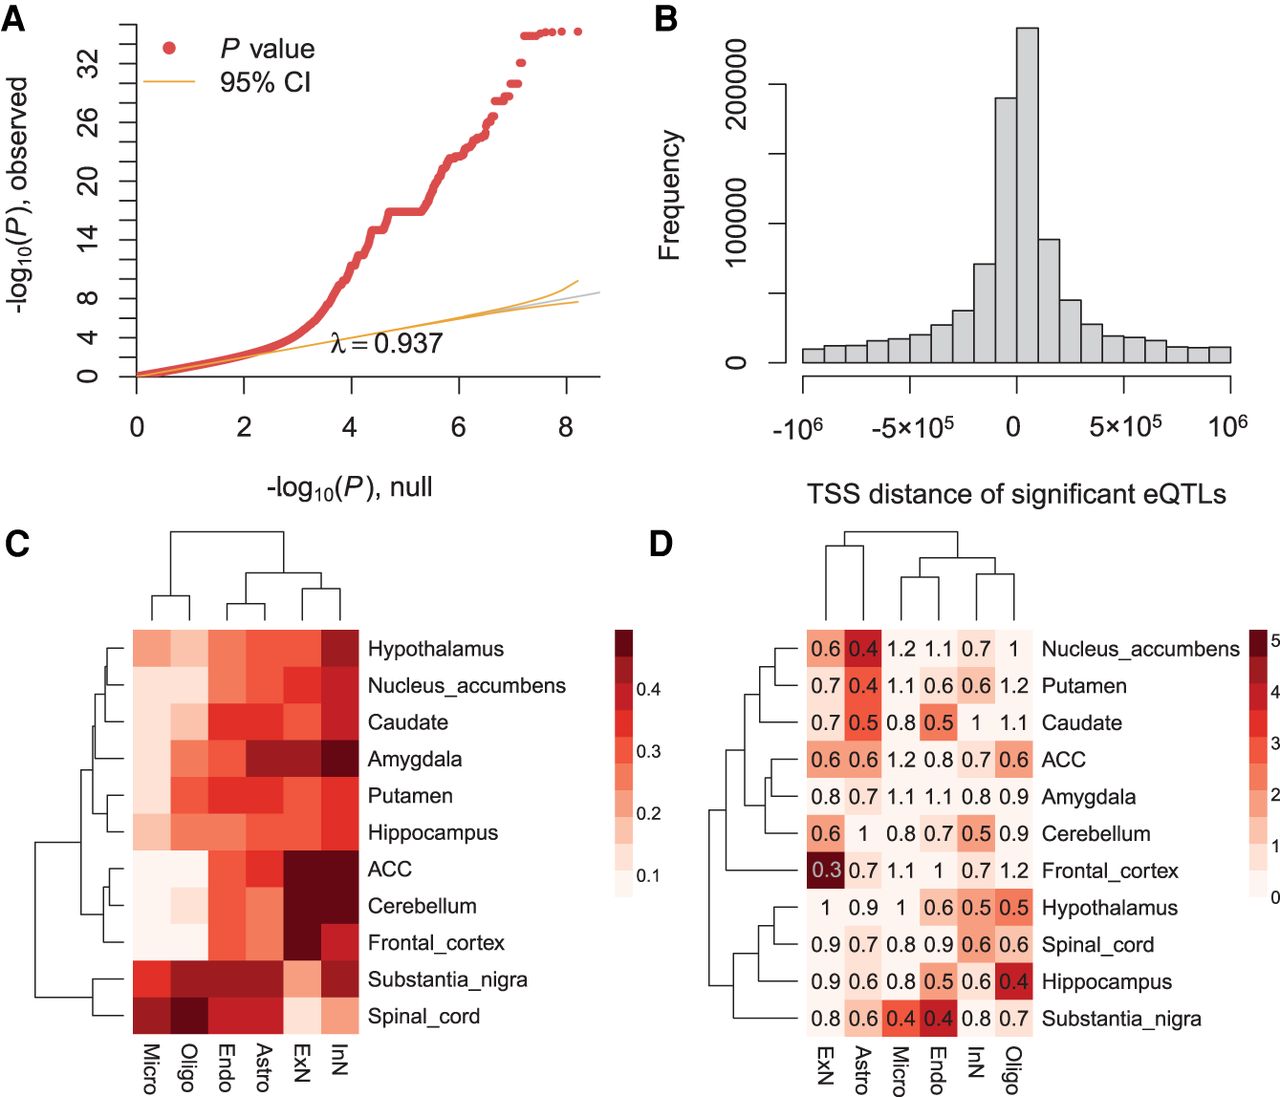
Figure 6.
Region-specific CTS eQTL analysis with GTEx V8 brain data. (A) The QQ-plot of P-values from eQTL analysis. Here, we show an example of microglia in substantia nigra. (B) The enrichment of significant eQTLs near TSS. Here, we present an example of excitatory neurons in the frontal cortex. (C) Fraction of GTEx brain bulk eQTLs detected as CTS eQTLs in each brain region. (ACC) Anterior cingulate cortex. (D) The enrichment analysis of ASD genes in region-specific CTS eGenes (genes with eQTLs). The heatmap color denotes −log10 transformed Benjamini–Hochberg adjusted P-values (Benjamini and Hochberg 1995) based on two-sided Fisher's exact tests, and the number represents the odds ratio.