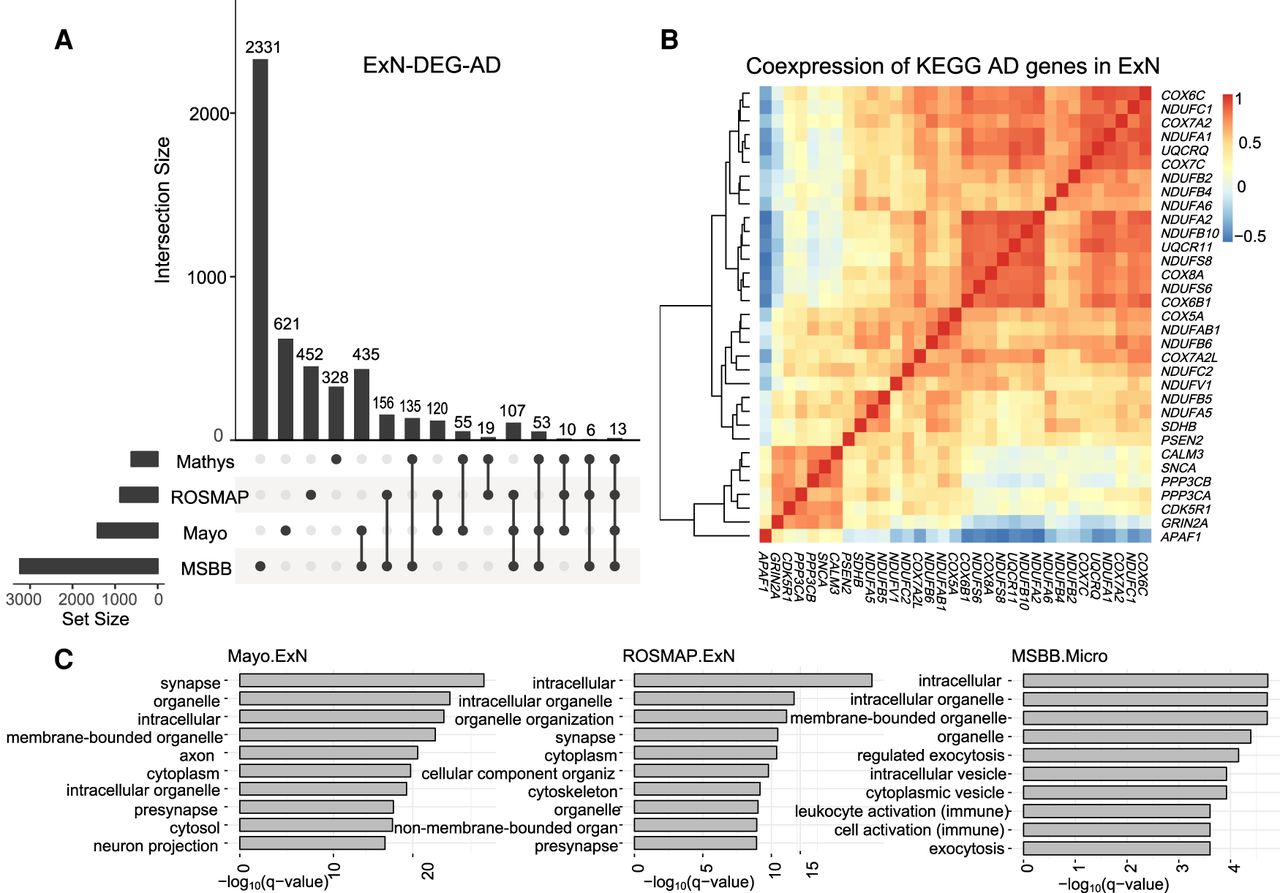
Figure 5.
CTS differential expression analysis of Alzheimer's disease. (A) Intersection of DEGs in excitatory neurons (ExN DEGs) related to AD identified in snRNA-seq data (Mathys et al. 2019) and three bulk RNA-seq data sets (ROSMAP, Mayo, and MSBB) by bMIND. (B) Correlation matrix of the intersection of ExN DEGs in Mayo data and the KEGG AD gene pathway. Correlation is computed using bMIND estimated sample-level CTS expression. (C) Gene Ontology enrichment analysis for ExN DEGs for Mayo and ROSMAP bulk data and microglia DEGs for MSBB data (MSBB.Micro). Here, we present the top 10 terms with FDR <0.05 for each cell type.