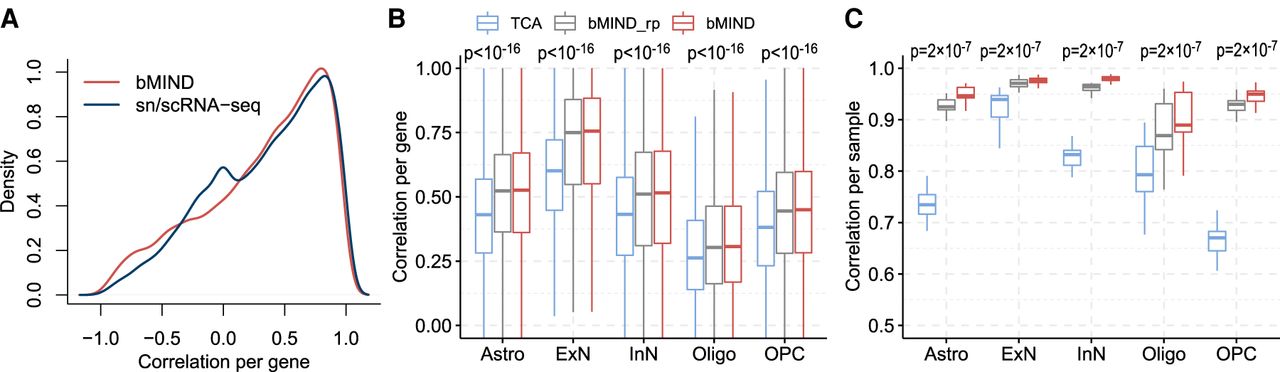
Correlation comparison for estimated sample-level CTS expression. (A) Correlation of average CTS gene expression (across samples), over cell type, obtained from two brain RNA-seq data sets (Parikshak et al. 2016; Velmeshev et al. 2019). For a benchmark, we assess the concordance between brain snRNA-seq data (Velmeshev et al. 2019) and scRNA-seq data (Darmanis et al. 2015) (labeled as sn/scRNA-seq). (B,C) Using realistic simulations, correlation between truth and estimated CTS expression are computed to compare TCA (Rahmani et al. 2019) with bMIND and bMIND_rp (using a rough prior). The task involved analyzing pseudo-bulk data generated from snRNA-seq data (Velmeshev et al. 2019) obtained from ASD subjects, and bMIND uses a prior derived from the corresponding controls. For each cell type, we compute correlation across samples for each gene (B), and correlation across genes for each sample (C). The P-values are obtained from paired one-tailed Wilcoxon test comparing TCA and bMIND_rp.