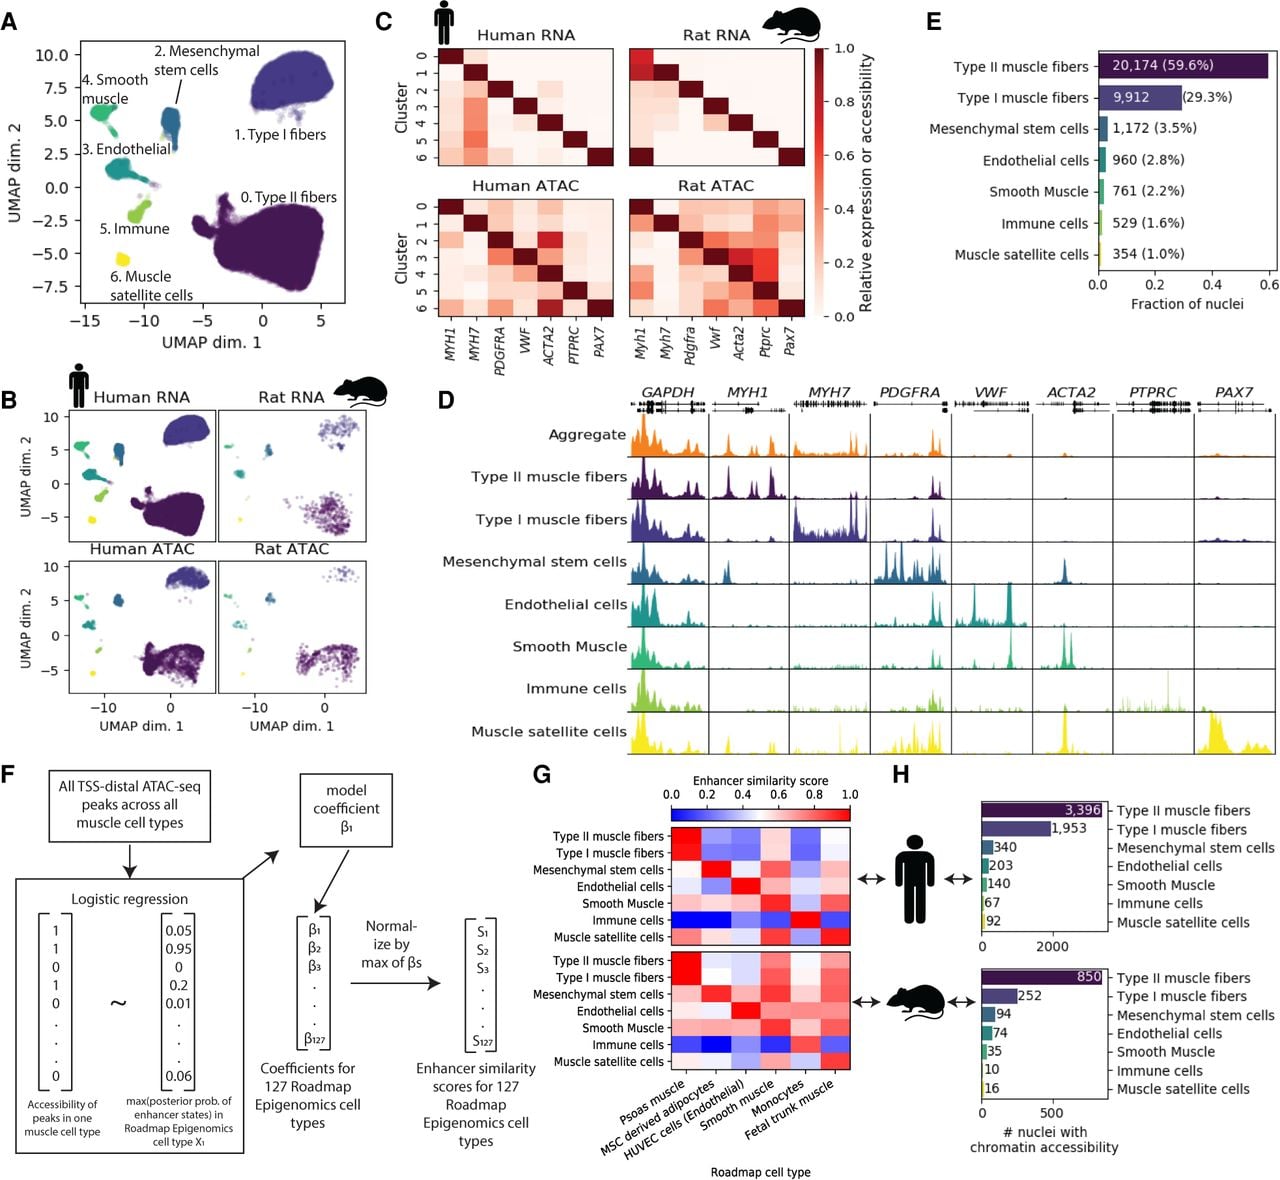
Joint clustering of human and rat snATAC-seq and snRNA-seq identifies skeletal muscle cell types. (A) UMAP after clustering human snATAC-seq, human snRNA-seq, rat snATAC-seq, and human and rat dual modality (snATAC-seq + snRNA-seq) nuclei with Seurat. (B) UMAP facetted by species and modality. Dual modality nuclei were clustered using RNA and are displayed within the “RNA” facets. (C) Gene expression (snRNA-seq, including dual modality nuclei RNA) or accessibility (snATAC-seq; gene promoter + gene body) of marker genes. Values are column-normalized. (D) ATAC-seq signal for human snATAC-seq (+ dual modality) nuclei in each cluster. All tracks are normalized to 1M reads. (E) Fraction of nuclei assigned to each cell type. (F) Logistic regression-based approach to score similarity between TSS-distal ATAC-seq peaks (>5 kb from TSS) and Roadmap Epigenomics enhancer states. For all TSS-distal ATAC-seq peaks across all cell types, we scored the accessibility of the peak (0/1) in each of the muscle cell types based on the presence or absence of a peak call. Then, for a given one of the 127 Roadmap Epigenomics cell types, we determined the maximum posterior probability of the enhancer states in the Roadmap Epigenomics ChromHMM model within each peak. We then used logistic regression to model the relationship between the peak accessibility and the enhancer posteriors (running one model per muscle cell type per Roadmap Epigenomics cell type). Then, for each muscle cell type, the model coefficient was normalized to 1 by dividing by the maximum coefficient across all 127 Roadmap Epigenomics cell types, and this value was used as the enhancer similarity score for that muscle cell type and Roadmap Epigenomics cell type. (G) Similarity of snATAC-seq peak calls for each cell type and species to Roadmap Epigenomics ChromHMM enhancer states based on the logistic regression procedure outlined in F. The Roadmap Epigenomics cell type names have been adjusted for clarity and the sake of space. The full names and the identifiers from the Roadmap Epigenomics paper are: psoas muscle (E100), mesenchymal stem cell–derived adipocyte cultured cells (E023), HUVEC umbilical vein endothelial primary cells (E122), stomach smooth muscle (E111), primary monocytes from peripheral blood (E029), and fetal muscle trunk (E089). (H) Nucleus counts per species for snATAC-seq data. Copyright disclosure for rat cartoon: Rat by Francisca Arévalo from the Noun Project (https://thenounproject.com/search/?q=rat&i=15130).