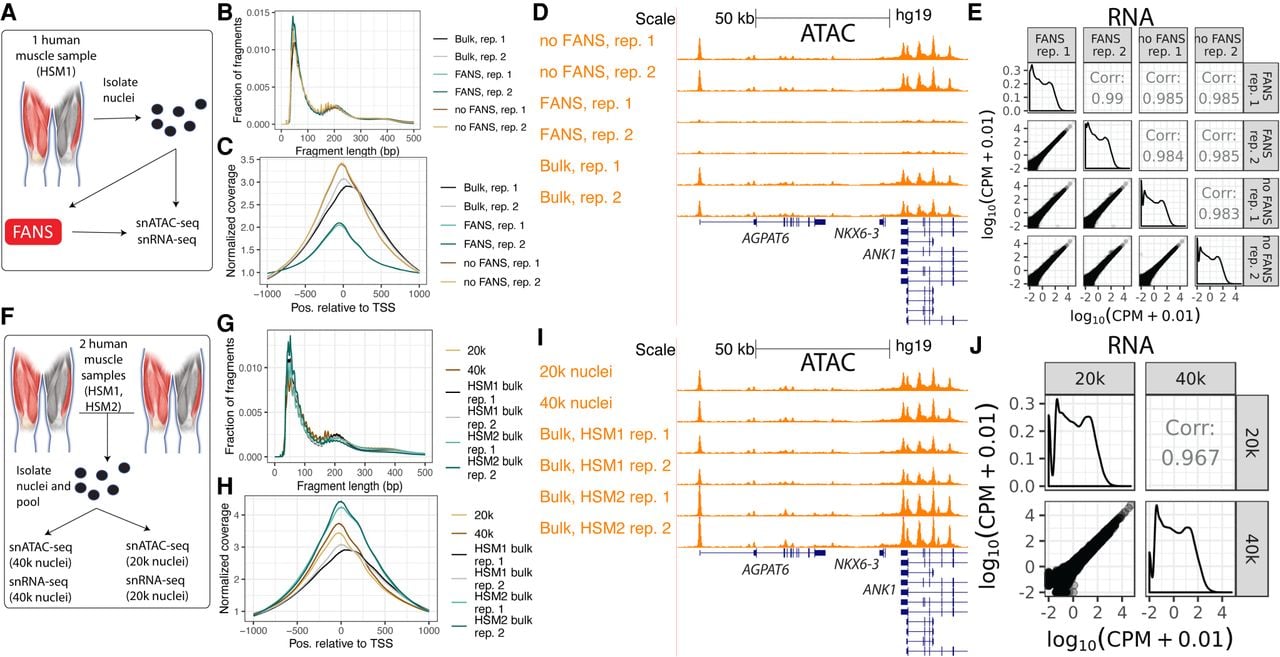
Impact of FANS and loading concentration on 10x Genomics snATAC-seq and snRNA-seq results. (A) Study design to determine the effect of FANS on snRNA-seq and snATAC-seq results. Muscle cartoon adapted from Scott et al. 2016. HSM1 refers to one specific skeletal muscle sample (“human skeletal muscle 1”). Bulk ATAC-seq was performed on HSM1 as well (two replicates, each separate nuclei isolations). (B) Fragment length distribution and (C) TSS enrichment for two snATAC-seq libraries that did not undergo FANS and two that did, as well as two bulk ATAC-seq replicates from the same sample (“Bulk”). (D) ATAC-seq signal at the ANK1 locus for FANS or non-FANS input snATAC-seq libraries, and the two bulk ATAC-seq libraries. All tracks are normalized to 1-M reads and have the same y-axis range corresponding to zero reads per million to three reads per million. Gene model (GENCODE v19 basic) displays protein coding genes only. (E) Correlation between FANS and non-FANS snRNA-seq libraries; each point represents one gene. (F) Study design to determine the effect of loading 20k versus 40k nuclei into the 10x platform, utilizing HSM1 as well as a second sample, HSM2 (“human skeletal muscle 2”). Bulk ATAC-seq was performed on HSM1 (same libraries as in A) and on HSM2 (two replicates, each separate nuclei isolations). (G) Fragment length distribution and (H) TSS enrichment for snATAC-seq libraries after loading 20k versus 40k nuclei, as well as for the four bulk ATAC-seq libraries (two each from the two muscle samples, “HSM1 bulk” and “HSM2 bulk”). (I) ATAC-seq signal at the ANK1 locus for the 20k and 40k libraries and the four bulk ATAC-seq libraries. All tracks are normalized as in D. Gene model (GENCODE v19 basic) displays protein coding genes only. (J) Correlation between snRNA-seq libraries resulting from loading 20k versus 40k nuclei.