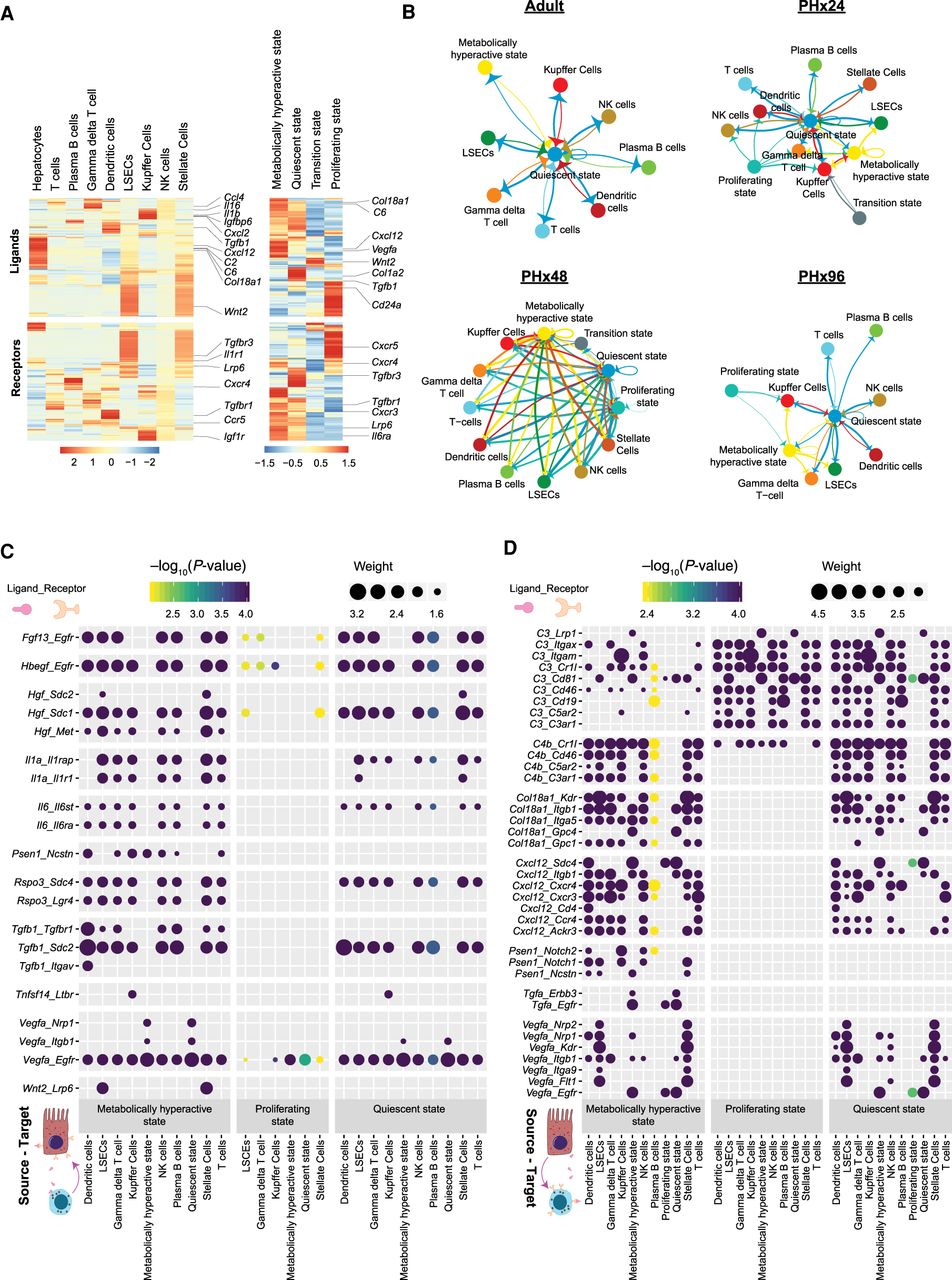
Dynamics of cell–cell interactions during liver regeneration. (A) Heat map showing expression of various ligand molecules and cellular receptors from different liver cell types (left) and from hepatocytes belonging to different cell states (right). (B) Network diagrams showing cell–cell interactions indicated by arrows (edges) pointing in the source-to-target direction. Thickness indicates the sum of weighted paths between populations, and the color of arrows corresponds to the source. Network diagrams for Adult, PHx24, PHx48, and PHx96 are shown. (C) Dot plot of representative inbound signals to hepatocytes at PHx48. Size of each dot indicates the weight of the corresponding ligand–receptor interaction and the color indicates negative log10 P-value of the source-to-target interaction. Empirical P-values were calculated and Benjamini–Hochberg correction was performed. (D) Dot plot of representative outbound signals from hepatocytes to various liver cells at PHx48.