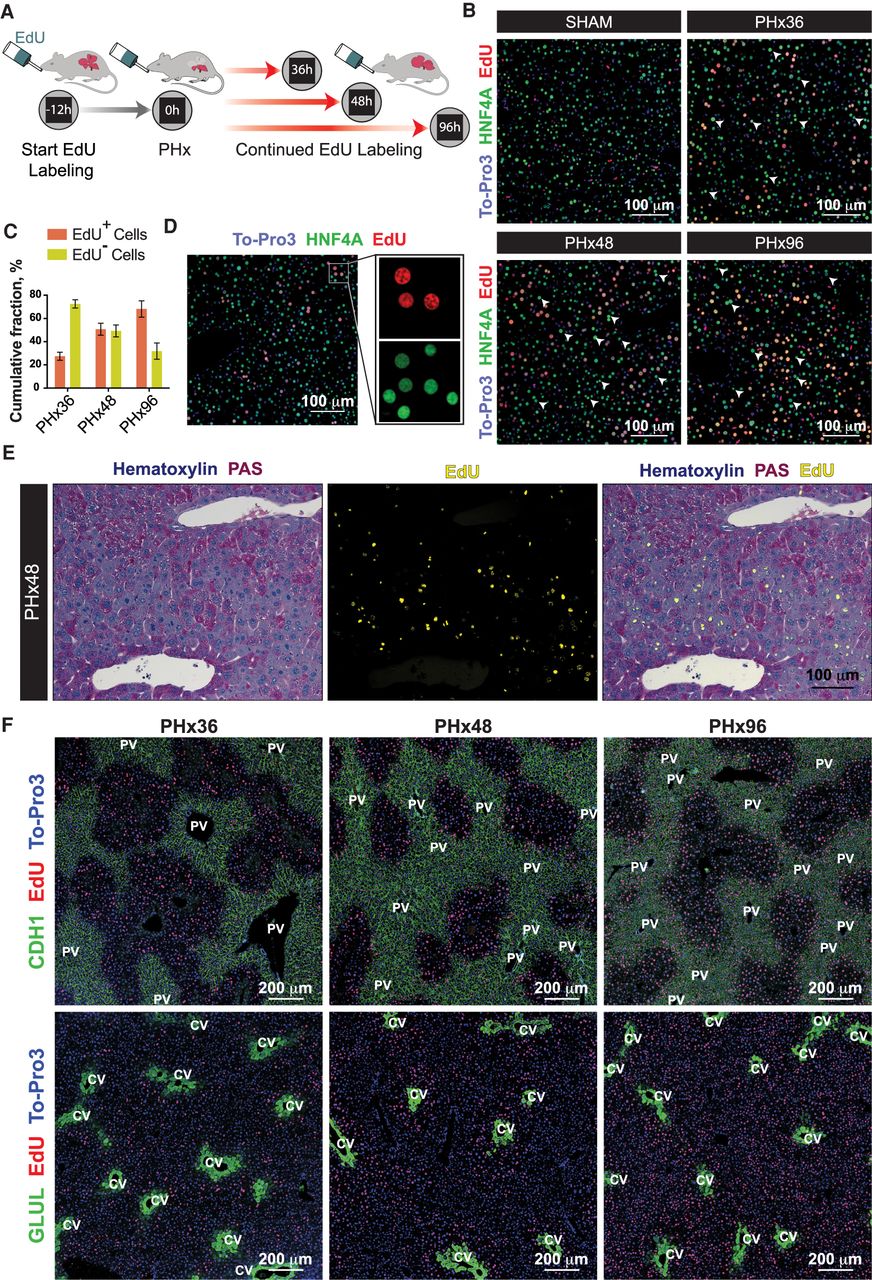
Proliferating and metabolically active hepatocytes are discretely localized within regenerating livers. (A) Schematic showing the experimental strategy for cumulative labeling of proliferating cells by continued feeding of EdU during liver regeneration. (B) Representative immunofluorescence images of proliferating hepatocytes measured by cumulative EdU incorporation after PHx or Sham surgeries (n = 4 mice/time point). Proliferating hepatocytes were colabeled for HNF4A (green) and EdU (red). White arrowheads point to the hepatocytes without any EdU incorporation at each time point, representing cells that had not proliferated. Nuclei were stained with To-Pro-3 dye (blue). (C) Percentages of proliferated (EdU+) and nonproliferated (EdU−) hepatocytes in regenerating livers at PHx36, 48, and 96 h. Data are mean ± SD; n = 4 mice/time point. (D) Representative immunofluorescence image demonstrating down-regulation of HNF4A protein specifically in proliferating nuclei (EdU+) of a regenerating liver. Liver sections were colabeled for HNF4A in green, EdU in red, and nuclei in blue. (E) Representative images showing an overlay of hepatic glycogen content by PAS staining (purple) and fluorescently detected EdU incorporation (yellow) in PHx48 livers. Nonproliferating hepatocytes exhibited minimal glycogen depletion (n = 4 mice/time point). (F) Representative immunofluorescence images showing spatial segregation of metabolic and proliferating hepatocytes through different phases of liver regeneration. Periportal (CHD1+) or pericentral (GLUL+) hepatocytes were colabeled (green) along with EdU (red). Nuclei were stained with To-Pro-3 dye (blue) (n = 4 mice/time point).