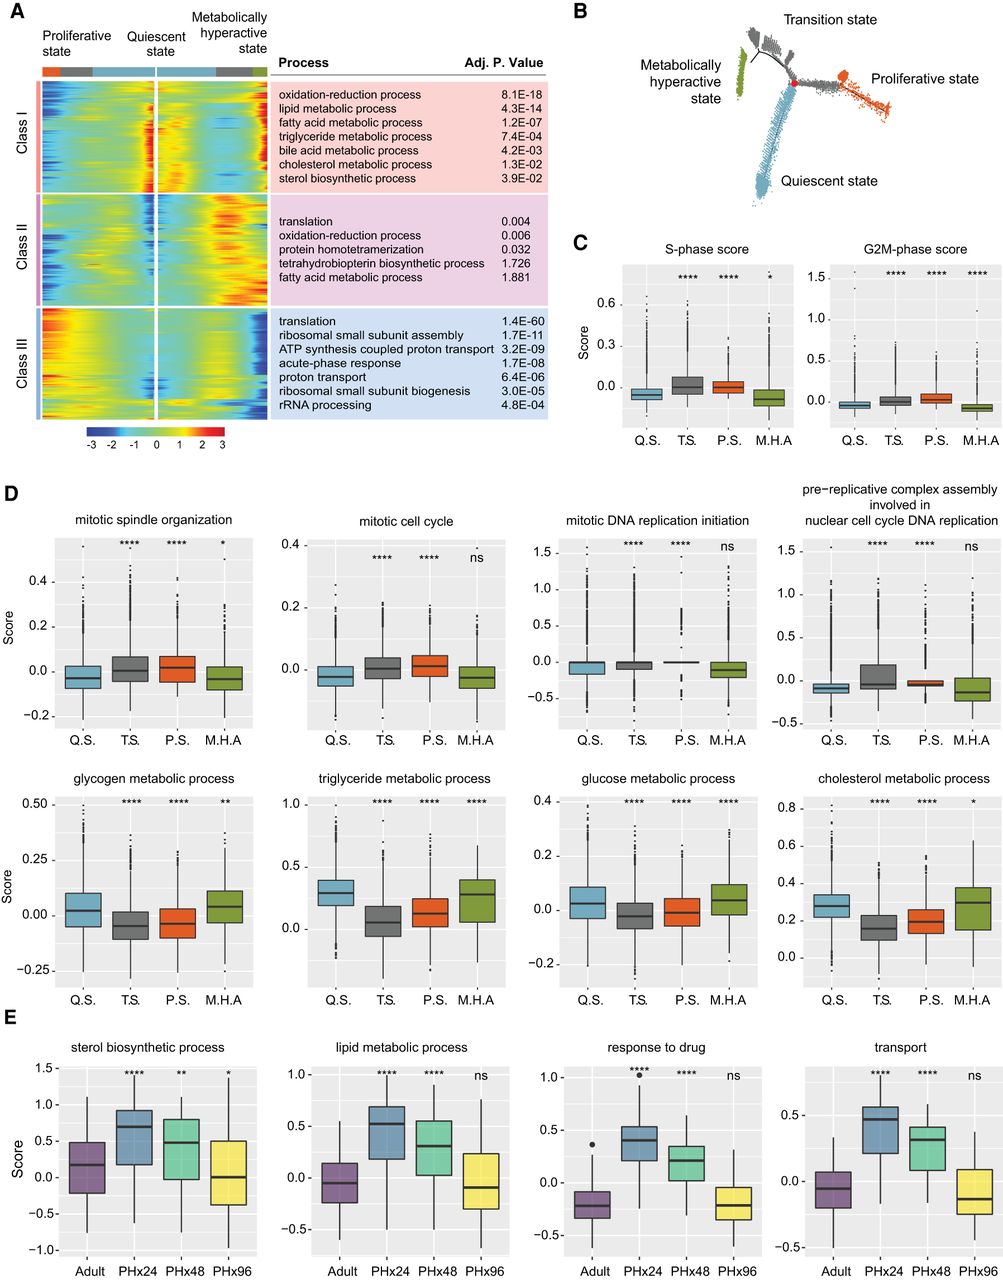
Bifurcation of hepatocyte trajectory during regeneration produces hepatocytes enriched with complementary functions in proliferation and metabolism. (A) Heat map showing bifurcating of gene expression programs executed along the pseudotime after branching. The top GO terms enriched in each class of genes are listed with their corresponding adjusted P-values. (B) Trajectory demonstrating the three distinct states of hepatocytes. The branch point under evaluation is shown in red. (C) Box plots demonstrating cell cycle phase scores calculated from Seurat v3.1 for hepatocytes belonging to different cell states. Q.S., T.S., P.S., and M.H.A. denote quiescent, transition, proliferating, and metabolically hyperactive states, respectively. P-values were derived from a parametric t-test (unpaired). (*) P ≤ 0.05, (****) P ≤ 0.0001. (D) “Proliferating” and “metabolically hyperactive” states uniquely up-regulate proliferation- or metabolism-related functions, respectively. Box plots showing relative scoring of indicated pathways in hepatocytes belonging to different states. P-values were derived from a parametric t-test (unpaired). (*) P ≤ 0.05, (**) P ≤ 0.01, (****) P ≤ 0.0001, (ns) P > 0.05. (E) Metabolically hyperactive state transiently up-regulates metabolism-related functions during regeneration. Box plots showing time point-based scoring of hepatocytes from the metabolically hyperactive state for the indicated pathways. P-values were derived from a parametric t-test (unpaired). (*) P ≤ 0.05, (**) P ≤ 0.01, (****) P ≤ 0.0001, (ns) P > 0.05.