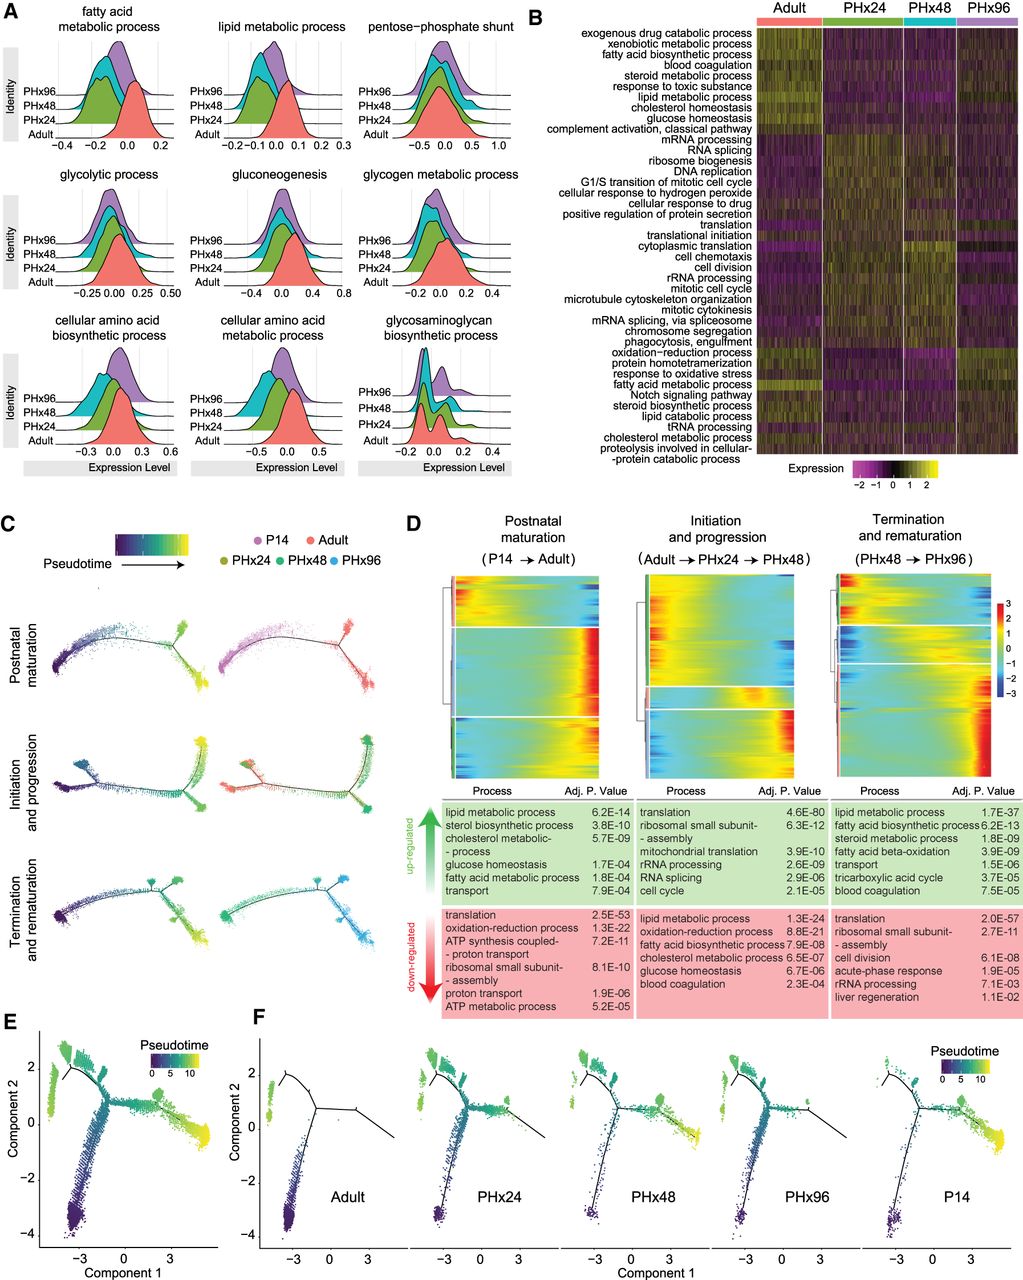
Specific hepatocyte population reversibly reprograms to an immature postnatal-like state during regeneration. (A) Ridge plots showing relative scoring on hepatocyte subpopulation using Seurat3.1 demonstrate extensive rewiring of metabolic genes during regeneration. Relative scores were computed based on the lists of genes for each pathway obtained from the Rat Genome Database (RGD). (B) Heat map showing relative scores of the top differentially regulated metabolic pathways. (C) Pseudotime plots demonstrating cellular trajectories during postnatal maturation (including P14 and adult hepatocytes), initiation, and progression (including adult, PHx24 and PHx48 hepatocytes), and termination and rematuration (including PHx48 and PHx96 hepatocytes). Single-cell trajectories were constructed and pseudotime values calculated using Monocle 2. Trajectories are colored by pseudotime (left) and sample identity (right). (D) Heat maps representing modules of genes that co-vary along the pseudotime during postnatal maturation, initiation–progression, and termination–rematuration phases. DAVID-based Gene Ontology (GO) analysis revealed that reversible reprogramming of developmentally regulated gene expression programs essentially reverts postnatal maturation, and this is followed by transitions that reinstate mature hepatic program. The top up-regulated and down-regulated GO terms are described below the respective heat maps. (E) Pseudotime plot indicating cellular trajectories of hepatocytes from all samples. Single-cell trajectories were constructed and pseudotime values were calculated using Monocle 2. Trajectories are colored by pseudotime. (F) Pseudotime plots showing distribution of each sample along combined cellular trajectories shown in C. The adult and P14 hepatocytes present distinct distributions along the trajectory; however, the distribution shifts toward P14 at PHx24–48 and back toward the adult at PHx96.