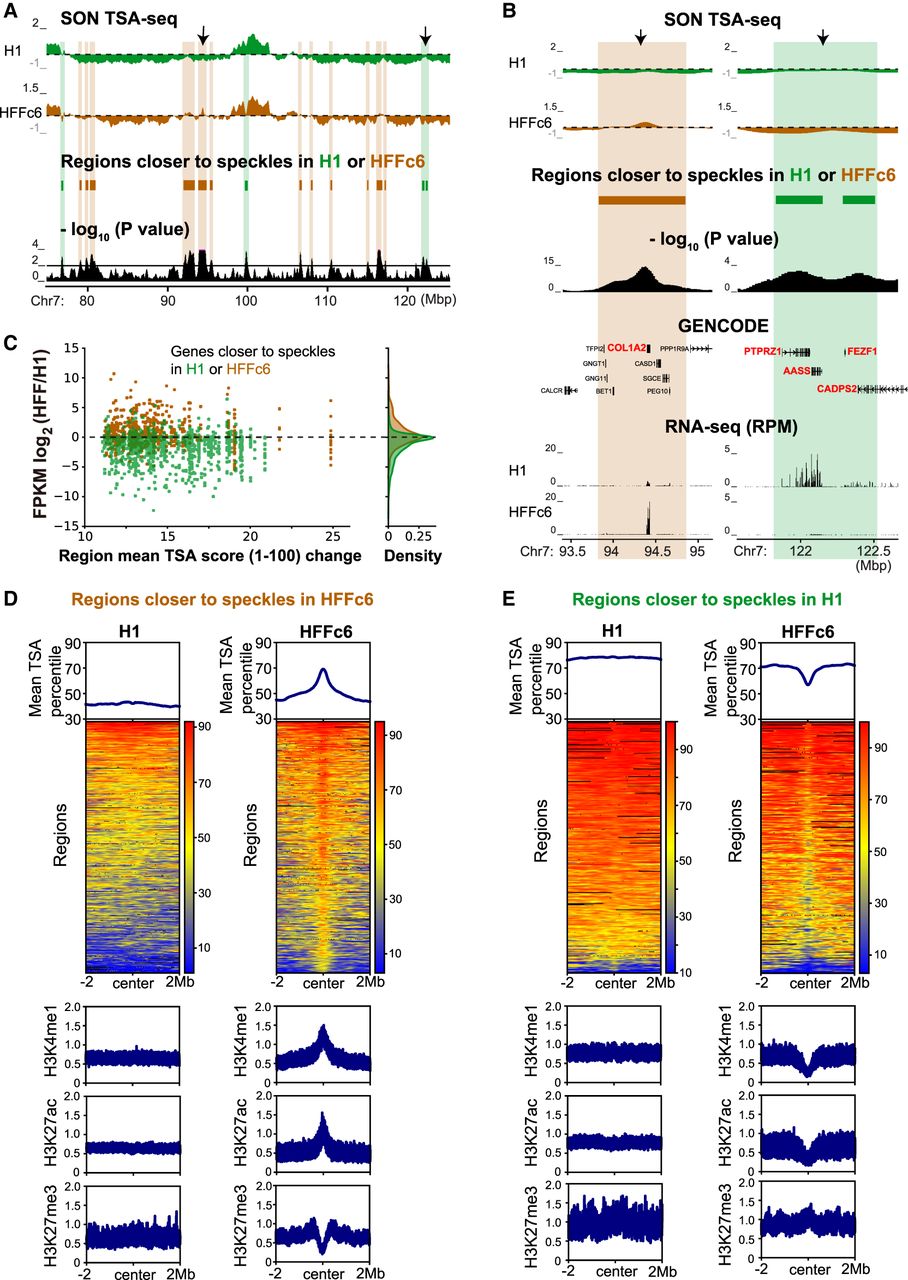
Chromosome regions changing position relative to speckles in H1 versus HFFc6 cells show changes in gene expression and histone modifications. (A) Top to bottom (domains shifting position highlighted): H1 (green) and HFFc6 (brown) smoothed SON TSA-seq enrichment scores (dashed lines: zero value), domains repositioned relative to speckles, and −log10 P-values per bin (significance of change in rescaled SON TSA-seq scores). (B,C) Strong bias toward increased gene expression in domains shifting closer to nuclear speckles: (B) zoomed view of two regions (arrows in A) plus gene annotation (GENCODE) and RNA-seq RPM values; (C) scatterplots show log2-fold changes in FPKM ratios (y-axis) between HFFc6 and H1 versus absolute values of changes in mean scaled TSA-seq scores (x-axis). Green (brown) dots are genes closer to speckles in H1 (HFFc6). Kernel density plots show gene density (right). (D,E) TSA-seq percentiles and histone modifications fold-enrichment for regions significantly closer to speckles in HFFc6 (D) or H1 (E) ±2 Mbps from each region center. Top: TSA-seq percentiles averaged over all regions; middle: heat maps with color-coded TSA-seq score percentiles; bottom: histone modification fold-enrichment for H3K4me1, H3K27Ac, or H3K27me3 averaged over all regions.