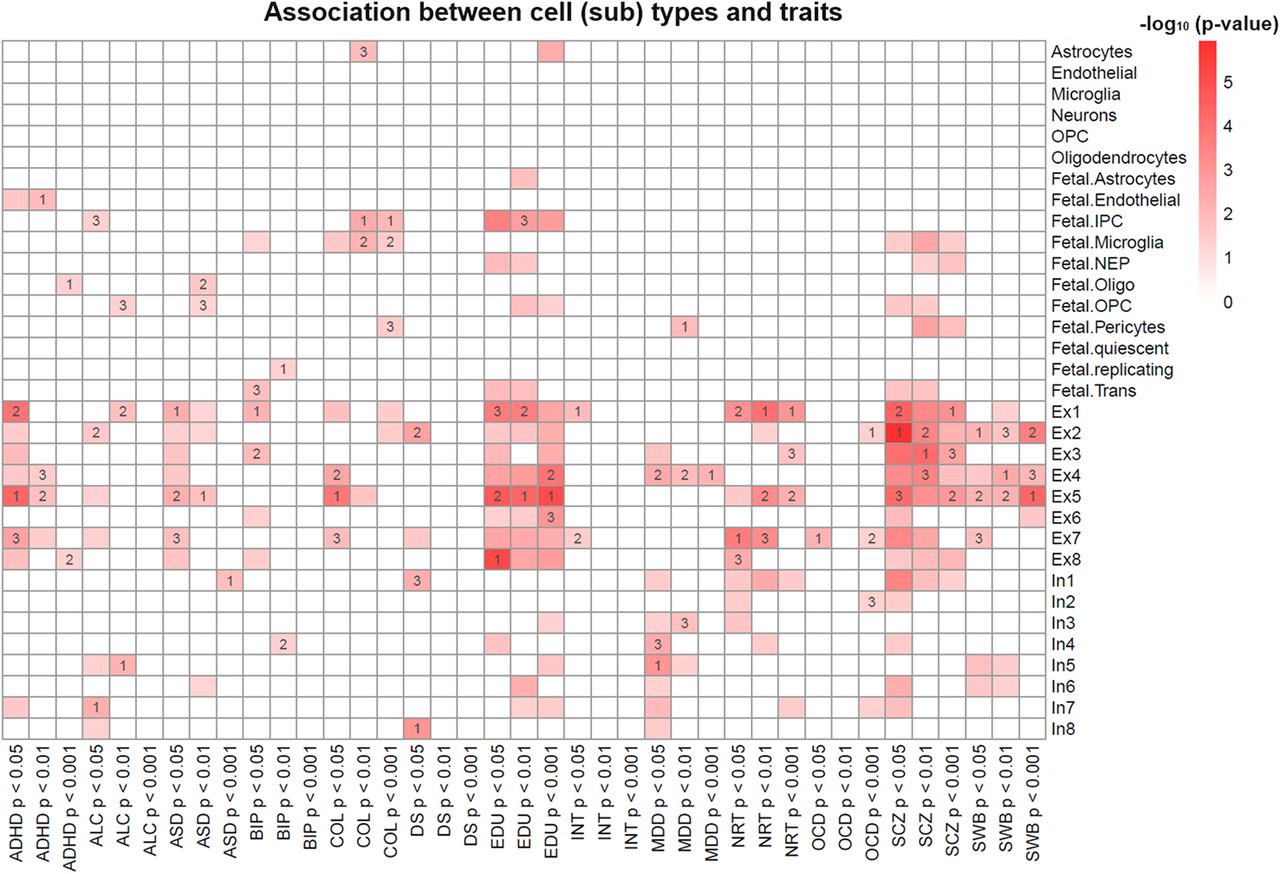
Figure 8.
Association between trait-associated genes and cell-type marker genes. The color scheme reflects the −log10 transformed P-value. The values 1, 2, and 3 in some cells indicated the rank of the corresponding cell type based on the Fisher's exact test. Nonsignificant associations (P-value ≥ 0.05) were replaced by blank color.