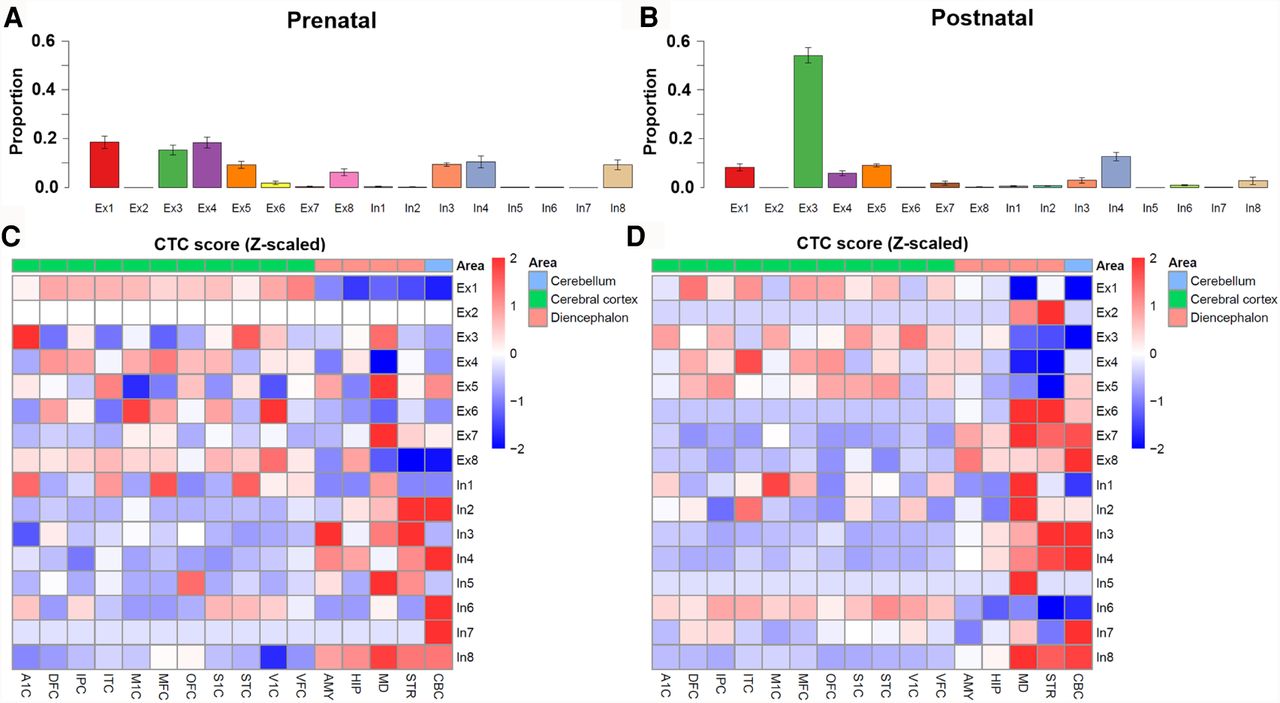
Figure 6.
Neuronal subtype deconvolution analysis. Relative proportion of neuronal subtype cell composition in prenatal (A) and postnatal (B). Error bar, SD of CTC scores across different patients and regions. Because the cell-type scores differed in several scale orders, we took z-score as the normalized CTC score to elucidate the correlation between neuronal subtype and brain region: (C) prenatal group and (D) postnatal group. We further separated 16 brain regions into three categories, (1) cerebral cortex (A1C, DFC, IPC, ITC, M1C, MFC, OFC, S1C, STC, V1C, VFC), (2) cerebellum (CBC), and (3) diencephalon region (AMY, HIP, MD, STR) for better visualizing.