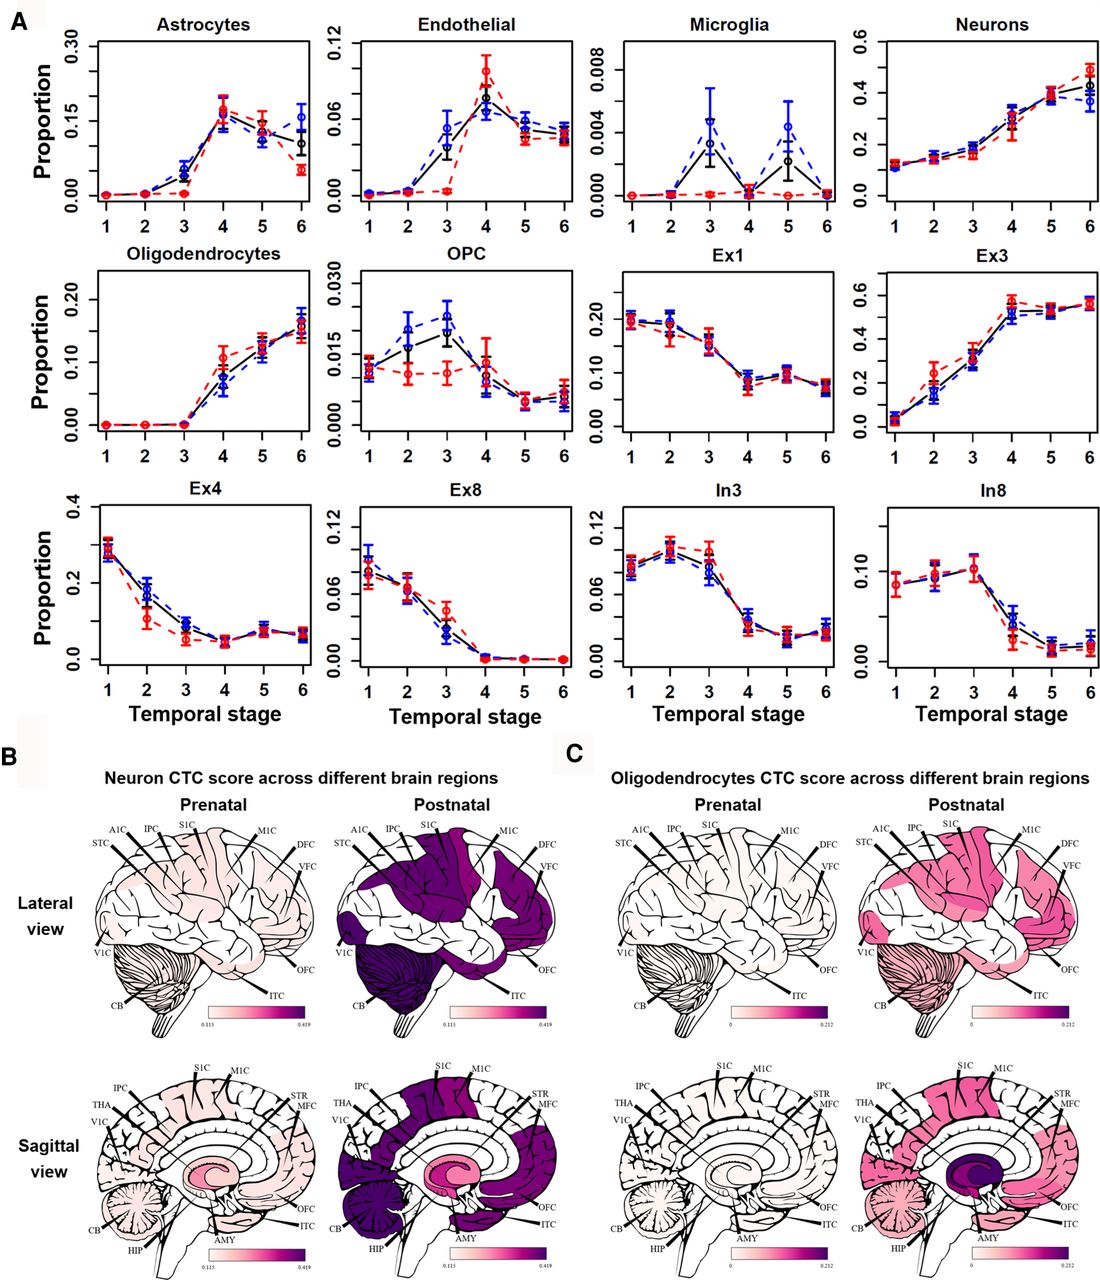
Figure 5.
Temporal and spatial changes in different cell-type compositions. (A) The black, blue, and red lines correspond to average CTC scores in all, male, and female individuals. Error bar, SD of replicates samples. Anatomical visualization of neuron (B) and oligodendrocyte (C) CTC score change between prenatal and postnatal groups across different regions.