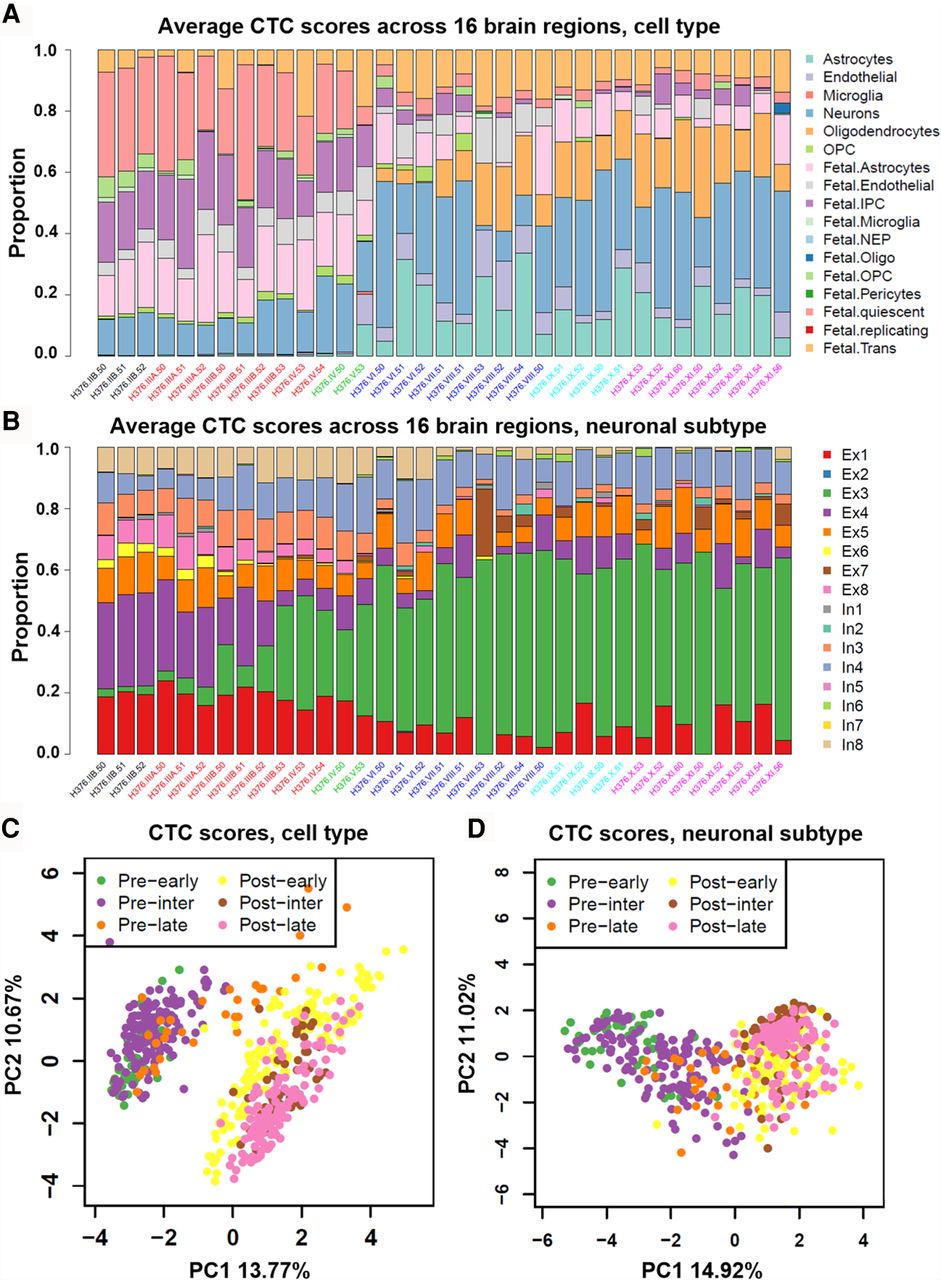
Figure 4.
Deconvolution analysis of BrainSpan bulk-cell RNA sequencing data. Schematic diagram of relative percent (16 regions averaged) of cell composition by two single-cell panels: (A) panel A, six adult + 11 fetal brain-related cell types, and (B) panel B, eight excitatory and eight inhibitory neuronal subtypes. Samples are colored according to their temporal attributes. PCA plot analysis according to CTC scores in panel A (C) and panel B (D).