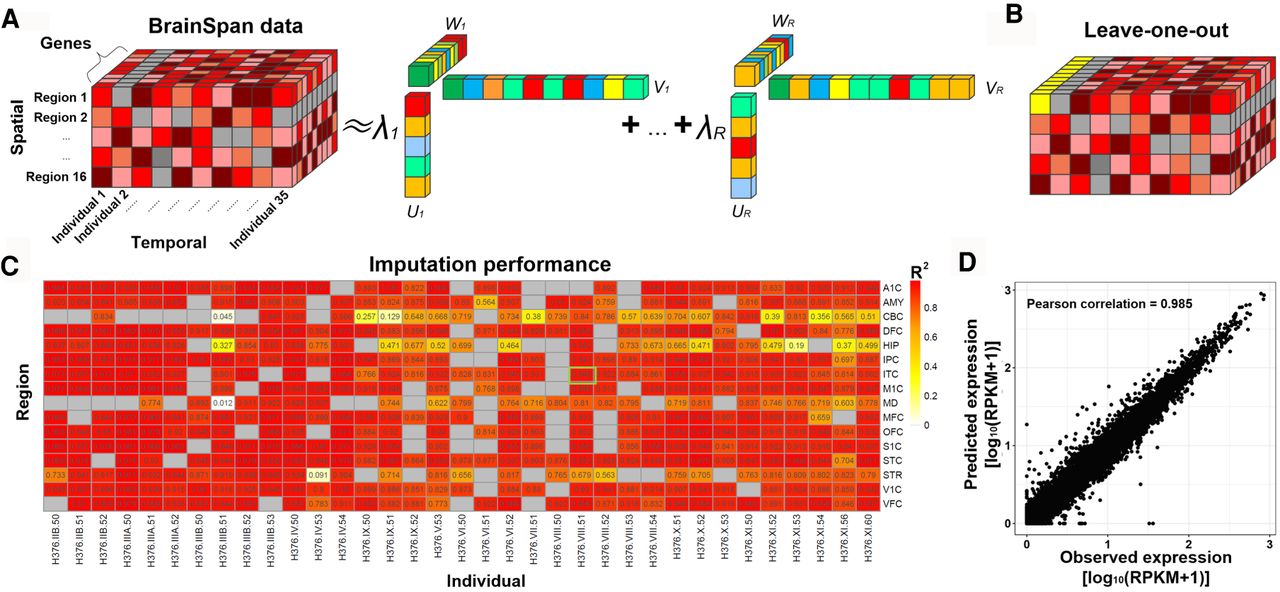
Figure 2.
BrainSpan data completion and imputation evaluation. (A) CANDECOMP/PARAFAC (CP) tensor decomposition framework. (B) The schematic diagram of leave-one-out (LOO) imputation evaluation strategy. Gray boxes represent missing values. Yellow boxes represent one leave-out sample, assuming all gene expression values in that column are not available. X-axis, y-axis, and z-axis correspond to individuals, brain regions, and genes, respectively. (C) R2 of imputation performance of BrainSpan data sets by LOO strategy. (D) One example showing the correlation between observed and predicted gene expression.