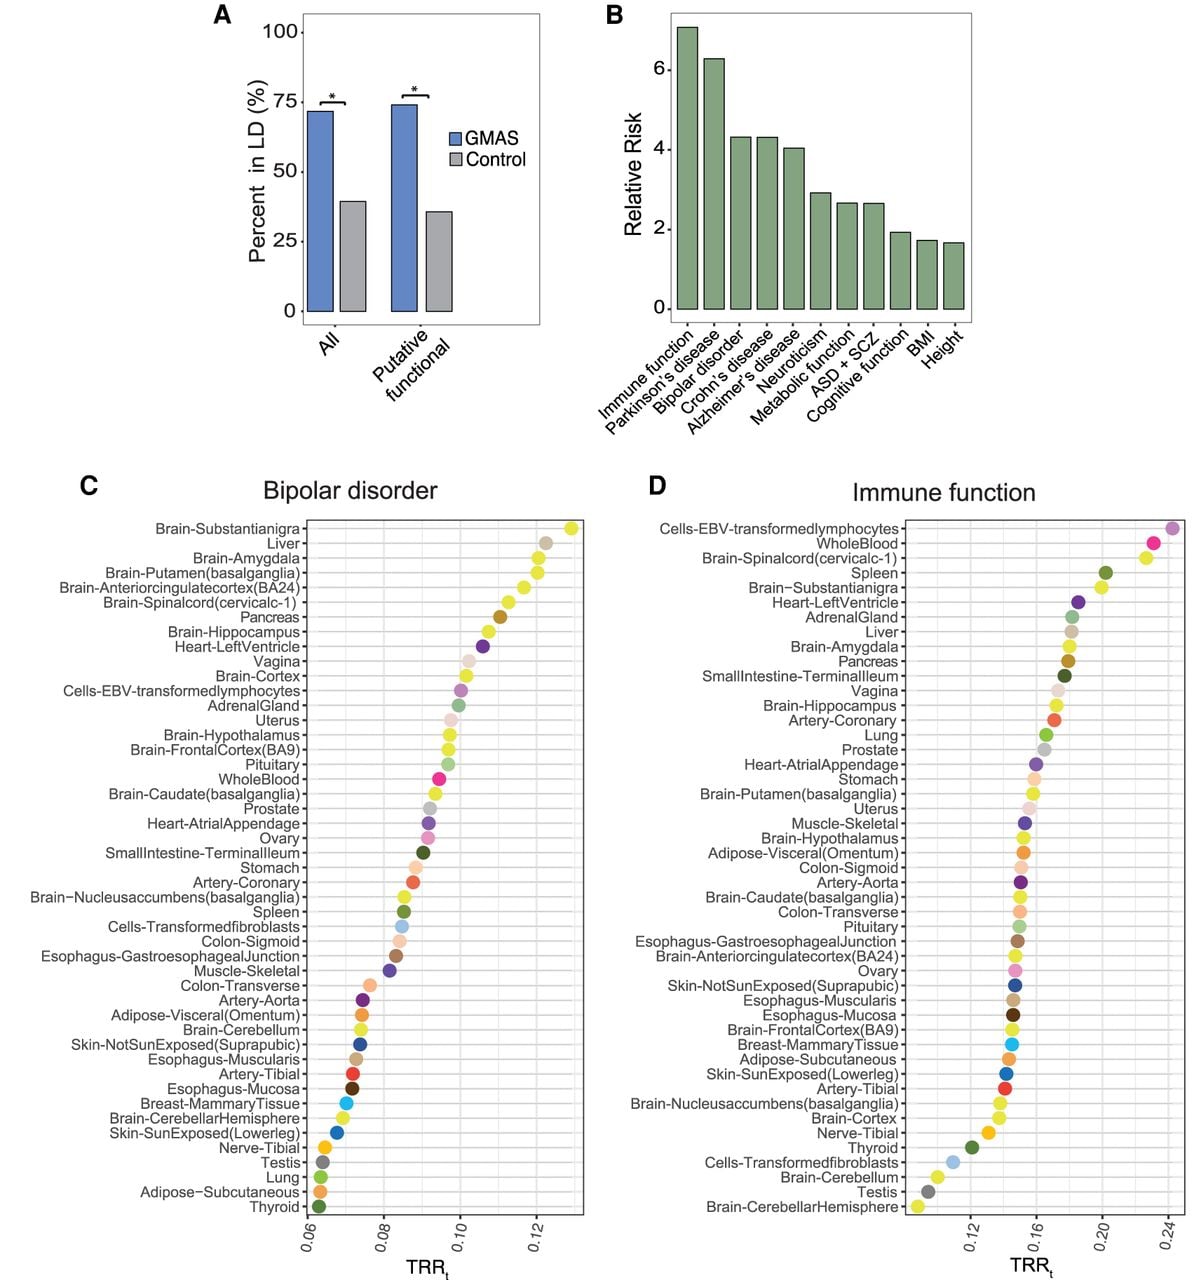
Figure 5.
Functional relevance of GMAS events. (A) Proportions of all GMAS SNPs and putative functional SNPs in LD with (and within 200 kb of) GWAS SNPs. Controls were random dbSNPs in genes that do not harbor GMAS SNPs. (*) P < 2.2 × 10⁻¹⁶ (Fisher's exact test). (B) Relative risk of GMAS SNPs in LD with selected trait/disease, defined as the ratio between the values in A of the GMAS and control groups for all GMAS SNPs. (ASD) Autism spectrum disorder, (SCZ) schizophrenia, (BMI) body mass index. All P-values < 2.2 × 10⁻¹⁶ (Fisher's exact test). (C,D) Trait-relevance ratio of each tissue (TRRt) defined as the proportion of GMAS SNPs identified in each tissue that were in LD with GWAS SNPs, for bipolar disorder and immune function, respectively.