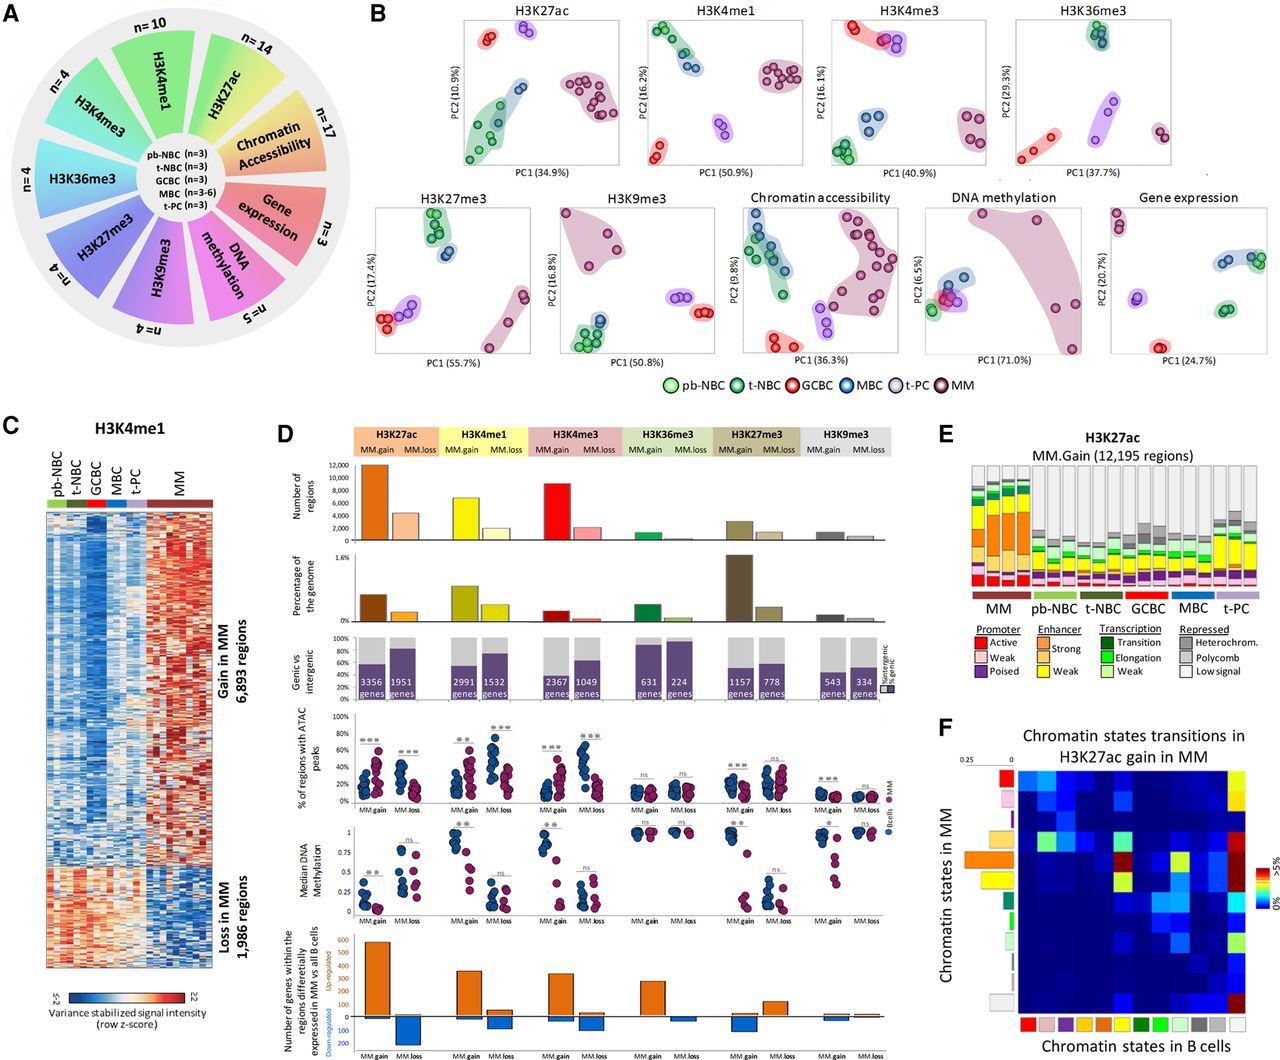
Initial characterization of epigenetic layers in multiple myeloma. (A) Schematic representation of the experimental design. The outer circle shows the numbers of MM samples for the nine epigenetic layers used in the study, while numbers of normal B cell samples are shown in the center. (B) Unsupervised principal component analysis for the nine layers of the epigenome. (C) Heat map representation of the regions with differential H3K4me1 occupancy in MM as compared to a stable pattern throughout normal B cell differentiation. (D) Characterization of regions with stable chromatin profiles throughout B cell differentiation showing either gain or loss of a specific histone mark in MM. From upper to lower panel: barplot showing number of regions detected for each condition; barplot showing total occupancy of the differential histone mark regions as a percentage of the whole genome; fractions of regions located in intergenic regions or inside genes (number of host genes associated with the differential regions shown in the graph); fraction of regions in MM (n = 17) and normal B cells (n = 15) harboring ATAC-seq peaks within regions with increase or decrease of particular histone marks in MM; median DNA methylation levels in MM (n = 5) and normal B cells (n = 12) within the regions with increase or decrease of particular histone mark in MM; barplots presenting number of host genes associated with the differential histone mark regions that are up-regulated or down-regulated in MM as compared to normal B cells (FDR < 0.05; |FC|>1.5). (E) Distribution of the different chromatin states in all analyzed samples separately at regions with increase of H3K27ac in MM as compared to normal B cells. (F) Chromatin state transition matrix for regions with increase of H3K27ac in MM as compared to normal B cells. Columns represent the chromatin state in normal B cells and rows are chromatin states in MMs that arise from normal B cells. The total matrix represents 100% of the differential regions. All P-values were calculated using a Student's t-test (two-sided). (*) P < 0.05, (**) P < 0.01, (***) P < 0.001, (ns) not significant. (pb-NBC) Naive B cells from blood, (t-NBC) naive B cells from tonsils, (GCBC) germinal center B cells, (MBC) memory B cells, (t-PC) plasma cell from tonsils, (MM) multiple myeloma.