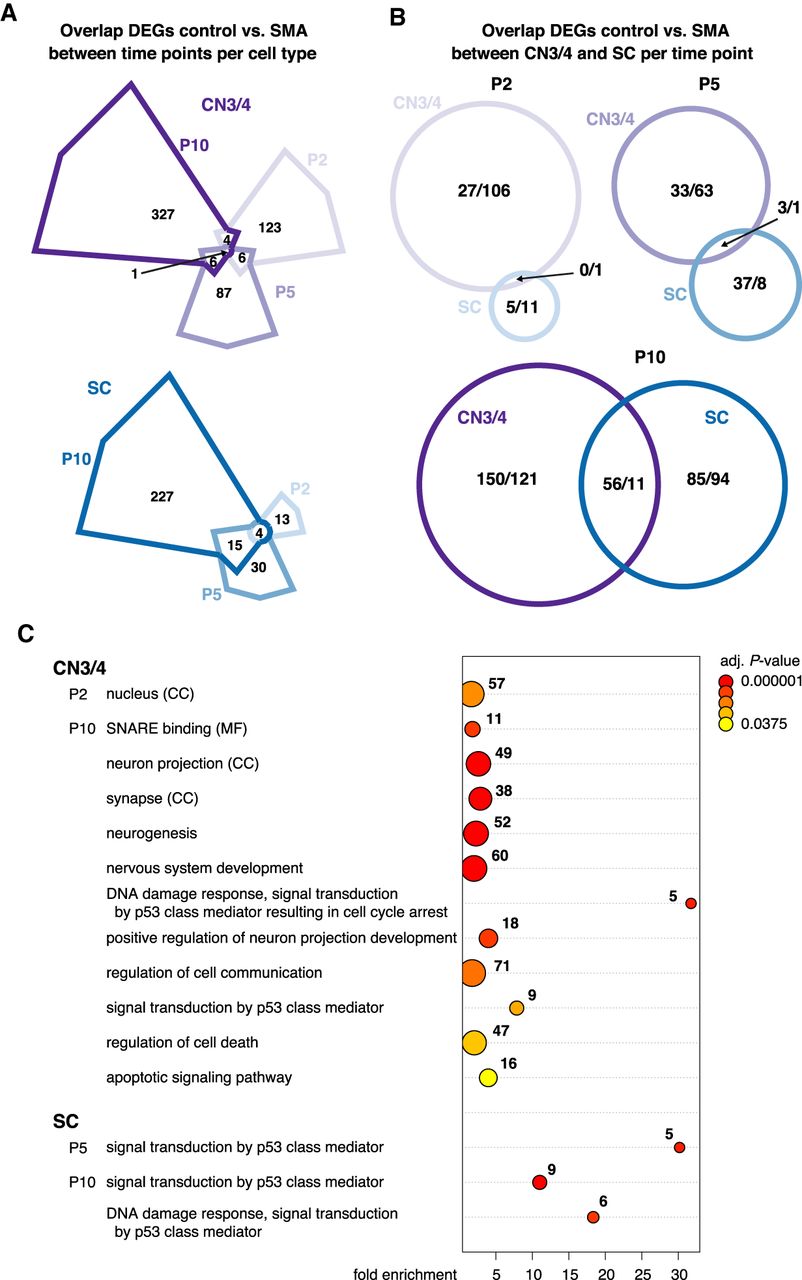
Figure 4.
Comparison of gene expression changes in ocular and spinal motor neurons. (A) Venn diagrams depicting shared and time point–specific DEGs between control and SMA motor neurons in CN3/4 (top) and SC (bottom). (B) Venn diagrams illustrating the overlap of DEGs between CN3/4 and SC at each time point. (C) GO term analysis of DEGs in CN3/4 and SC per time point. Shown are selected terms; a complete list of enriched terms can be found in Supplemental Table S9. Numbers indicate the number of genes in a given term, and the color scale shows the adjusted P-value. Terms belong to the domain biological processes unless specified otherwise: (CC) cellular compartment; (MF) molecular function.