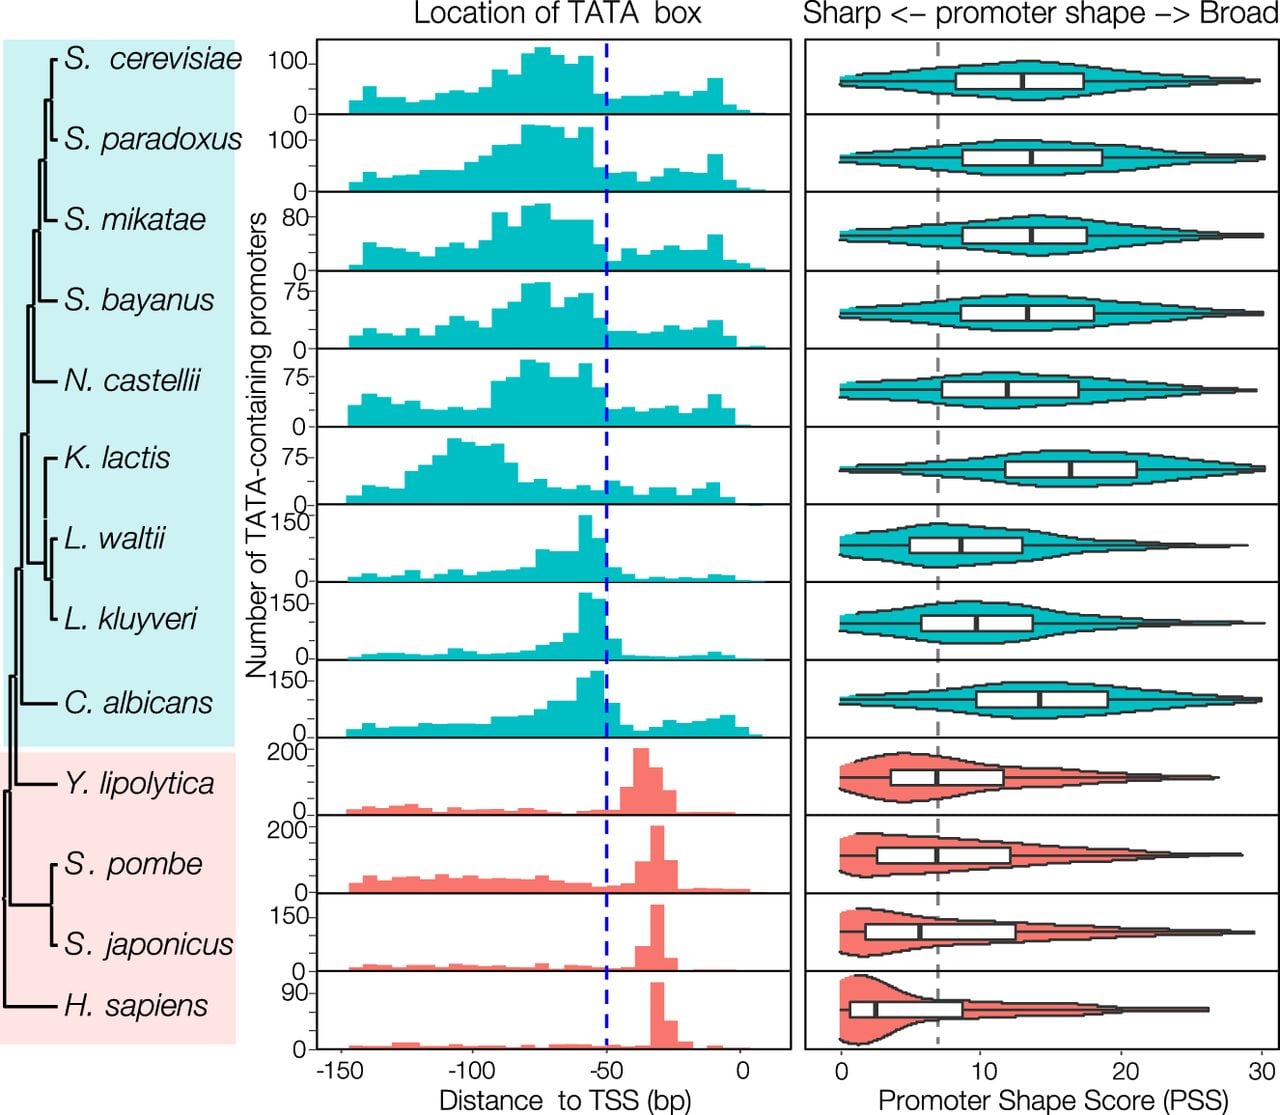
Inference of transcription initiation mechanisms using TATA-containing promoters. The left panel displays phylogenetic relationships of the 12 yeast species with human as an outgroup. The middle panel shows the distributions of distances between the TATA box (TATAWAWR) and TSS in each species. The numbers of TATA-containing promoters and genes in each species are provided in Supplemental Table S4. The blue dashed line indicates the location of the −50 position. The names of the scanning-model species are shaded in cyan, and classic-model species are shaded in salmon. The right panel shows the distribution of promoter shape score (PSS) of TATA-containing promoters in each species. The gray dashed line indicates the median PSS value of Y. lipolytica, S. pombe, and S. japonicus.